
This document outlines the hands-on exercises I completed with Splunk Enterprise, demonstrating my proficiency in log ingestion, search queries, dashboard creation, and data analysis. These exercises provided practical experience in:
- Installing and configuring Splunk
- Ingesting and analyzing logs
- Performing basic and advanced Splunk searches
- Creating tables and dashboards for real-time monitoring
- Extracting insights from log events
Additionally, I have included resources for Windows users to gain deeper insights into Splunk’s functionality.
Table of Contents
Splunk SIEM Hands-on Project: Installation, Queries & Dashboard for SOC Analysts
Splunk SIEM Hands-on Project: Completed Tasks
Splunk Installation and Lab Setup
Downloaded and installed Splunk Enterprise.
Configured the Splunk instance and accessed the Splunk Web Interface.
Verified successful installation by running test queries.
Configuring Log Ingestion
Set up local event log collection.
Configured Splunk to ingest Application, Security, and System logs.
Enabled data inputs and confirmed successful log ingestion.
Basic Splunk Search
Performed a wildcard search (*) to display all indexed events.
Used host, source, and EventCode filters to refine searches.
Applied conditional filters to extract specific event data.
Advanced Log Analysis and Event Monitoring
Conducted security log analysis by filtering Windows Event Logs.
Extracted insights from logs related to user authentication and failed login attempts.
Created field extractions to enhance search efficiency.
Creating Tables and Dashboards
Designed structured data tables to visualize critical log events.
Created and customized a dashboard for monitoring system activities.
Implemented chart visualizations for enhanced data representation.
Prerequisites
Splunk Instance: These hands-on exercises require a Splunk instance for practicing data ingestion, searching, dashboard development, graphing, reporting, analysis, and visualization. I used the Splunk environment provided by the tutor.
Splunk Enterprise: The Splunk content was delivered through a Splunk Cloud Platform (YouTube) and was accessible using the Splunk Enterprise credentials provided by the tutor.
Objectives
> Installing and configuring Splunk
> Managing and configuring Splunk Installations in my local system
> Design and build a dashboard to visualize key metrics and trends for multiple use cases.
Description
In this exercise, I created my Splunk Enterprise instance using the Splunk Show portal provided by the tutor.
✅ Step 1:
I went to Splunk’s official website and logged in using my Splunk.com account.
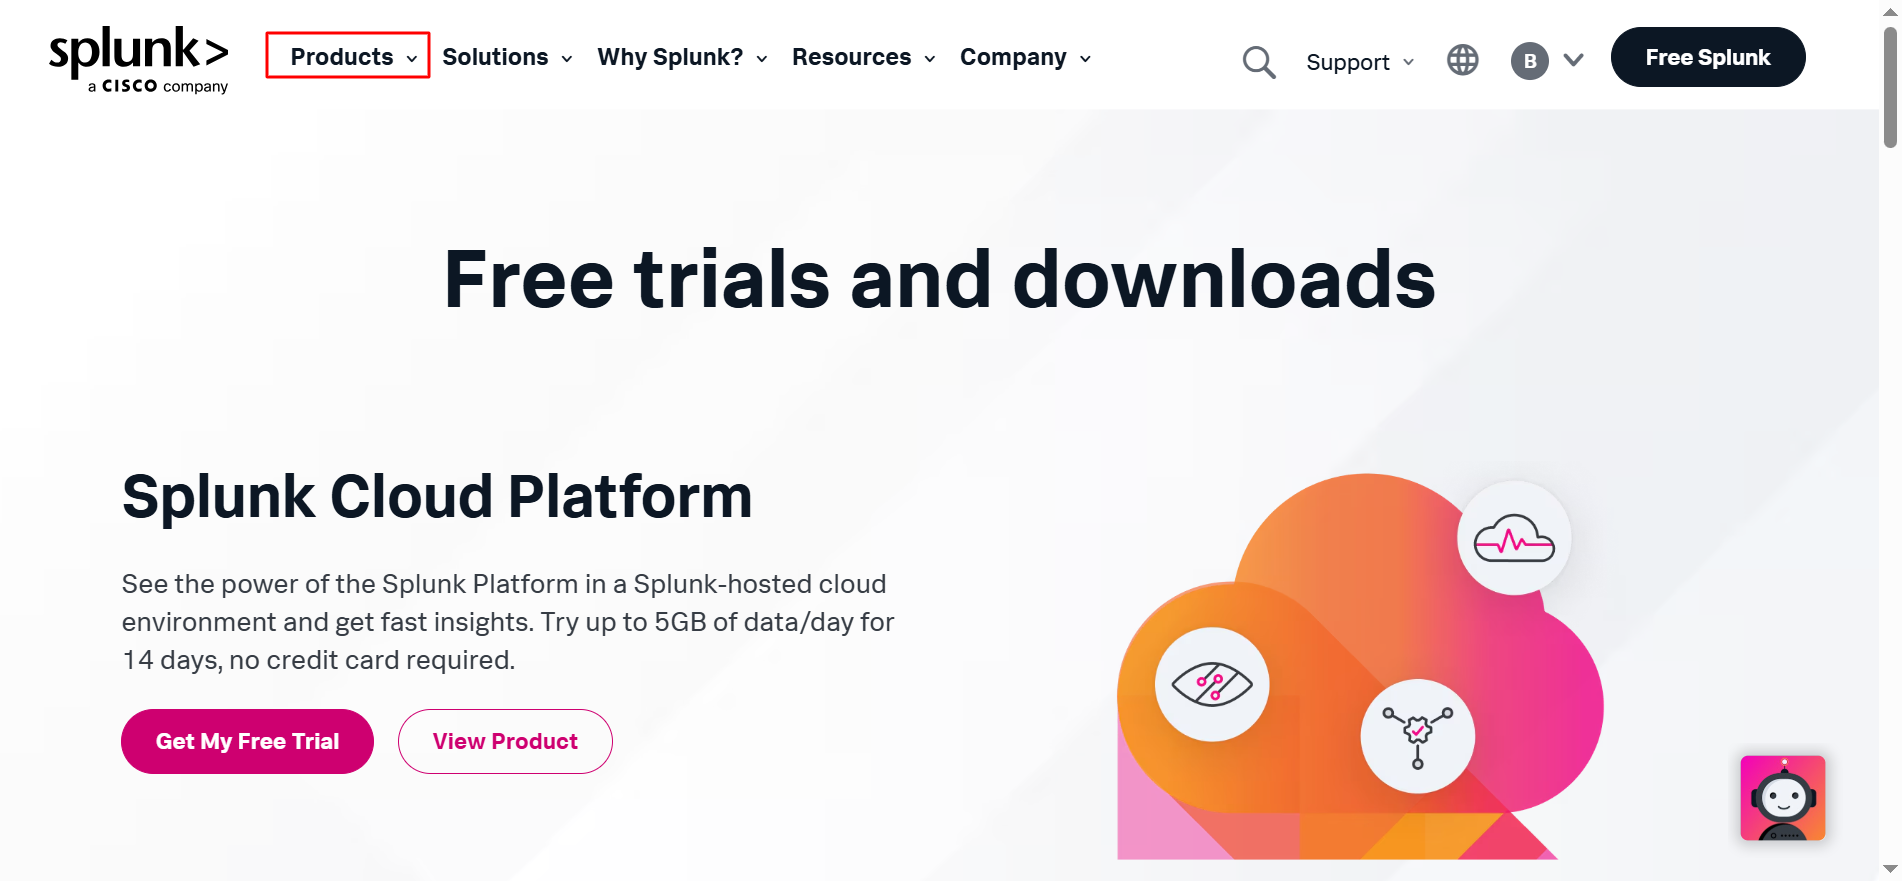
Source: Splunk
✅ Step 2:
2. After downloading Splunk, I navigated to the product section then to Splunk Enterprise. I scrolled down to the Instances Information section and expanded the ‘Splunk Enterprise’ section to locate the user credentials and the link to my lab environment after creating my account.
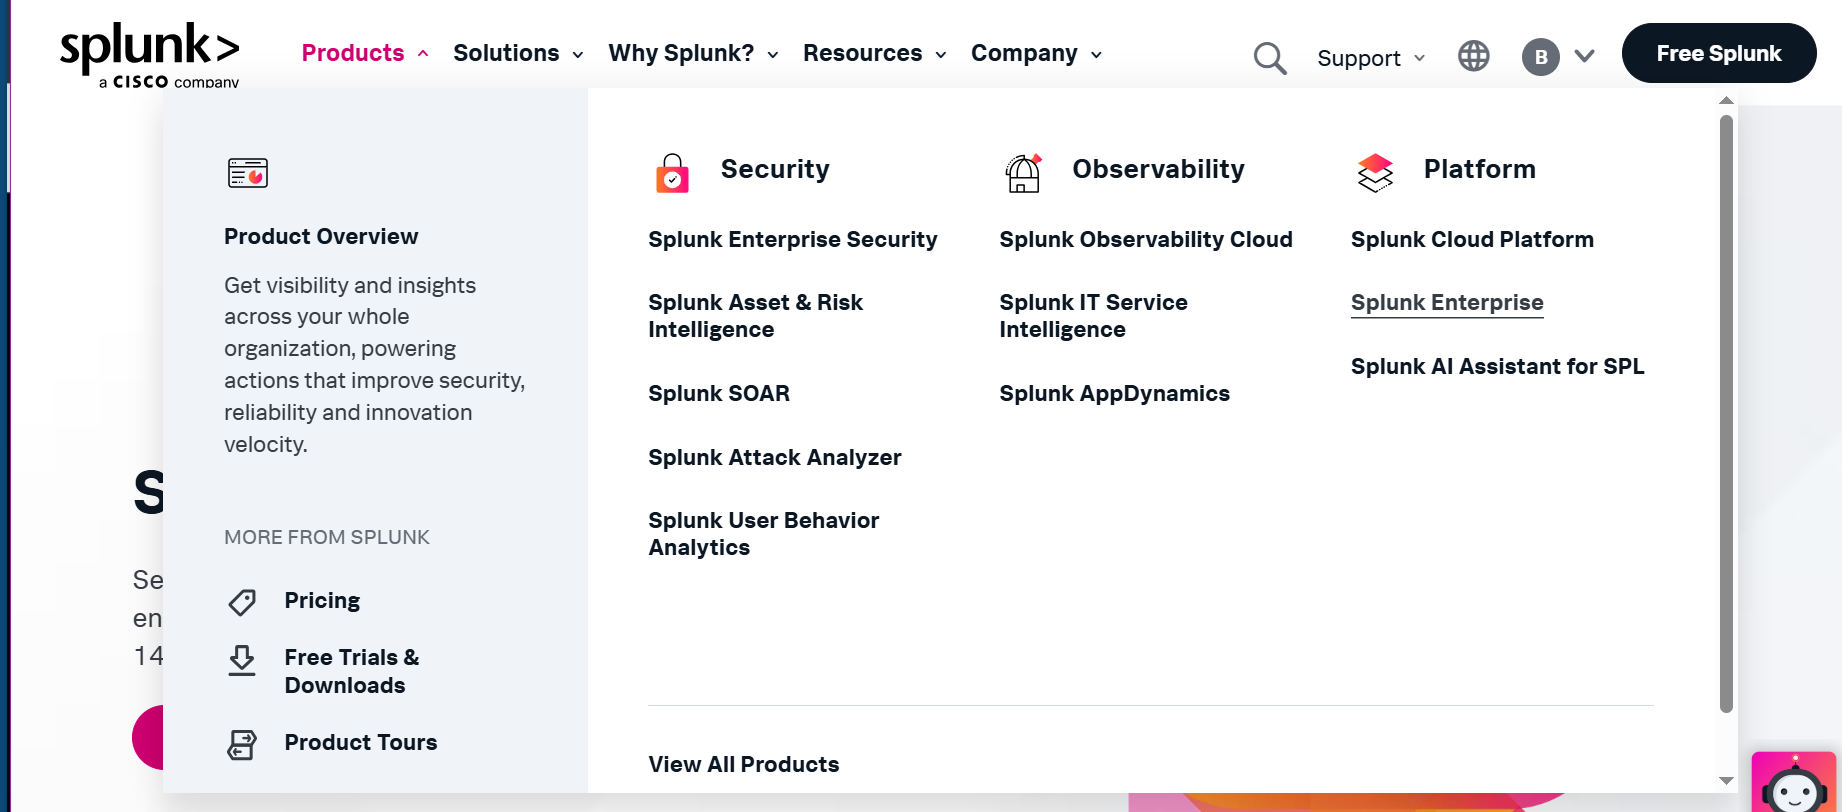
Source: Splunk
✅ Step 3:
3. I logged in using the provided username and password (also available from the Splunk Show event).

✅Step 4: After successfully installing and logging into Splunk, I set up my logs by navigating to the right sidebar of the screen, selecting Settings, and then clicking on Data Inputs.
✅Step 5: Since I am dealing with local events on my system, I navigate to Local Event Log Collection and select Edit. Next, we need to choose the logs that will be ingested into the tool. To keep it simple, we will select Application, Security, and System logs, as they form the foundation of log collection. Then, we scroll down and click Save. The save status should be enabled because it allows the system to ingest logs.
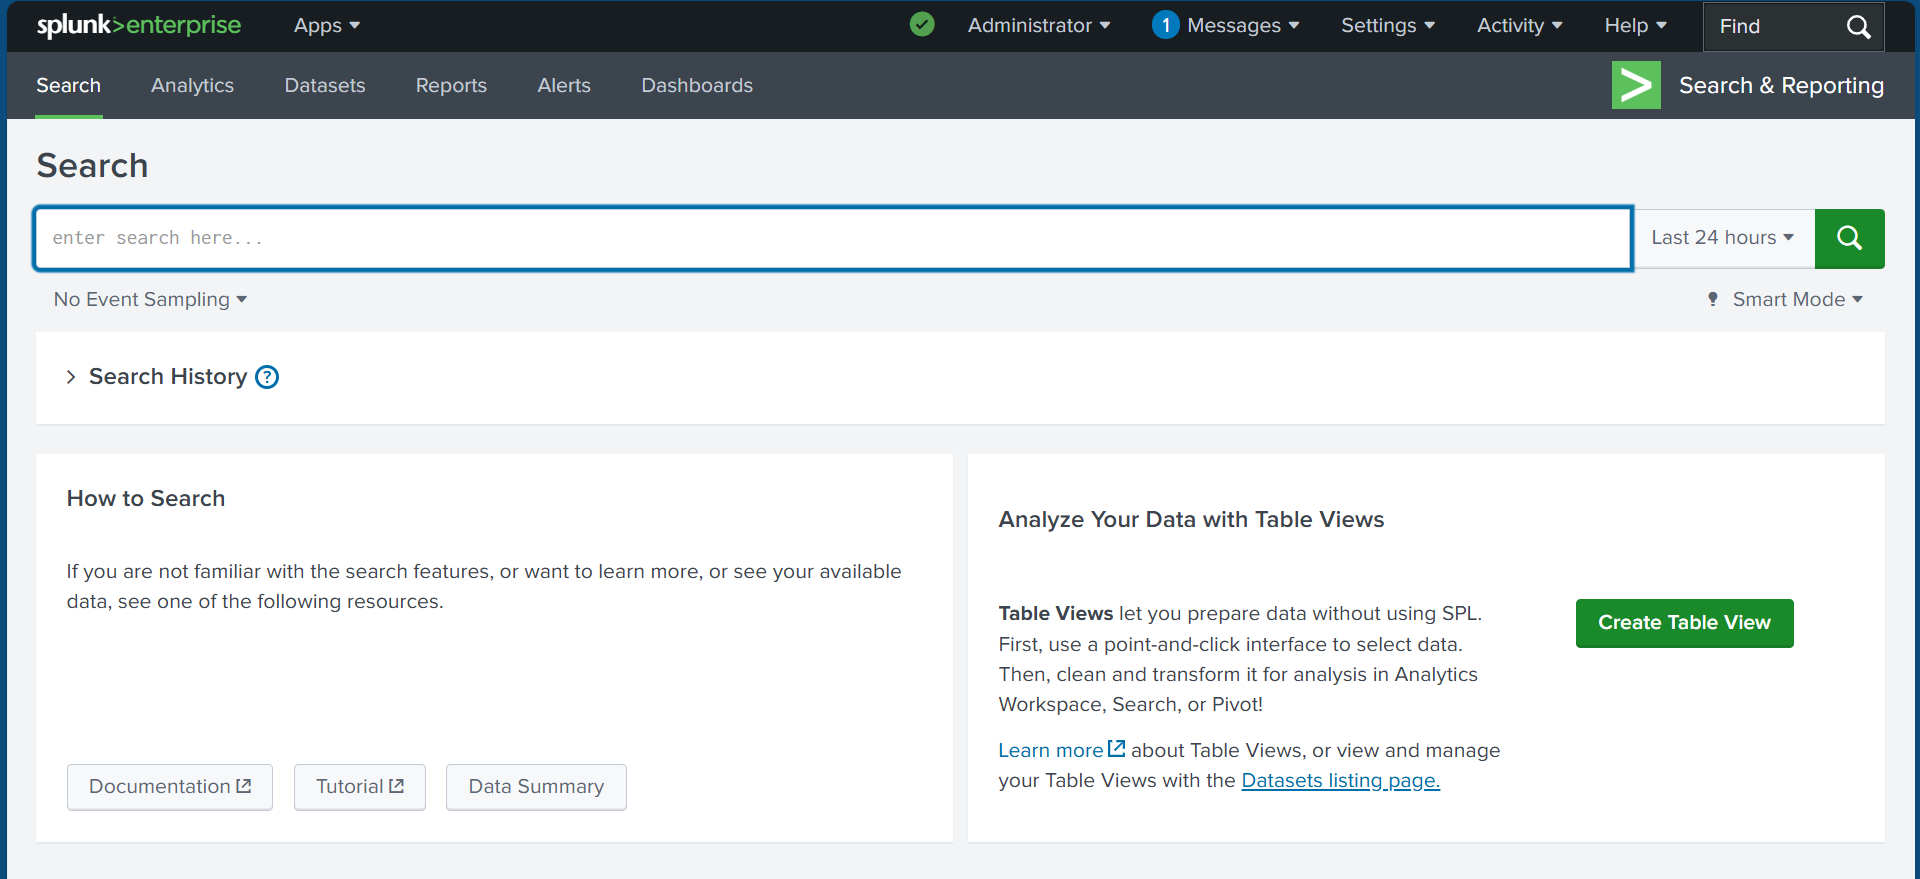
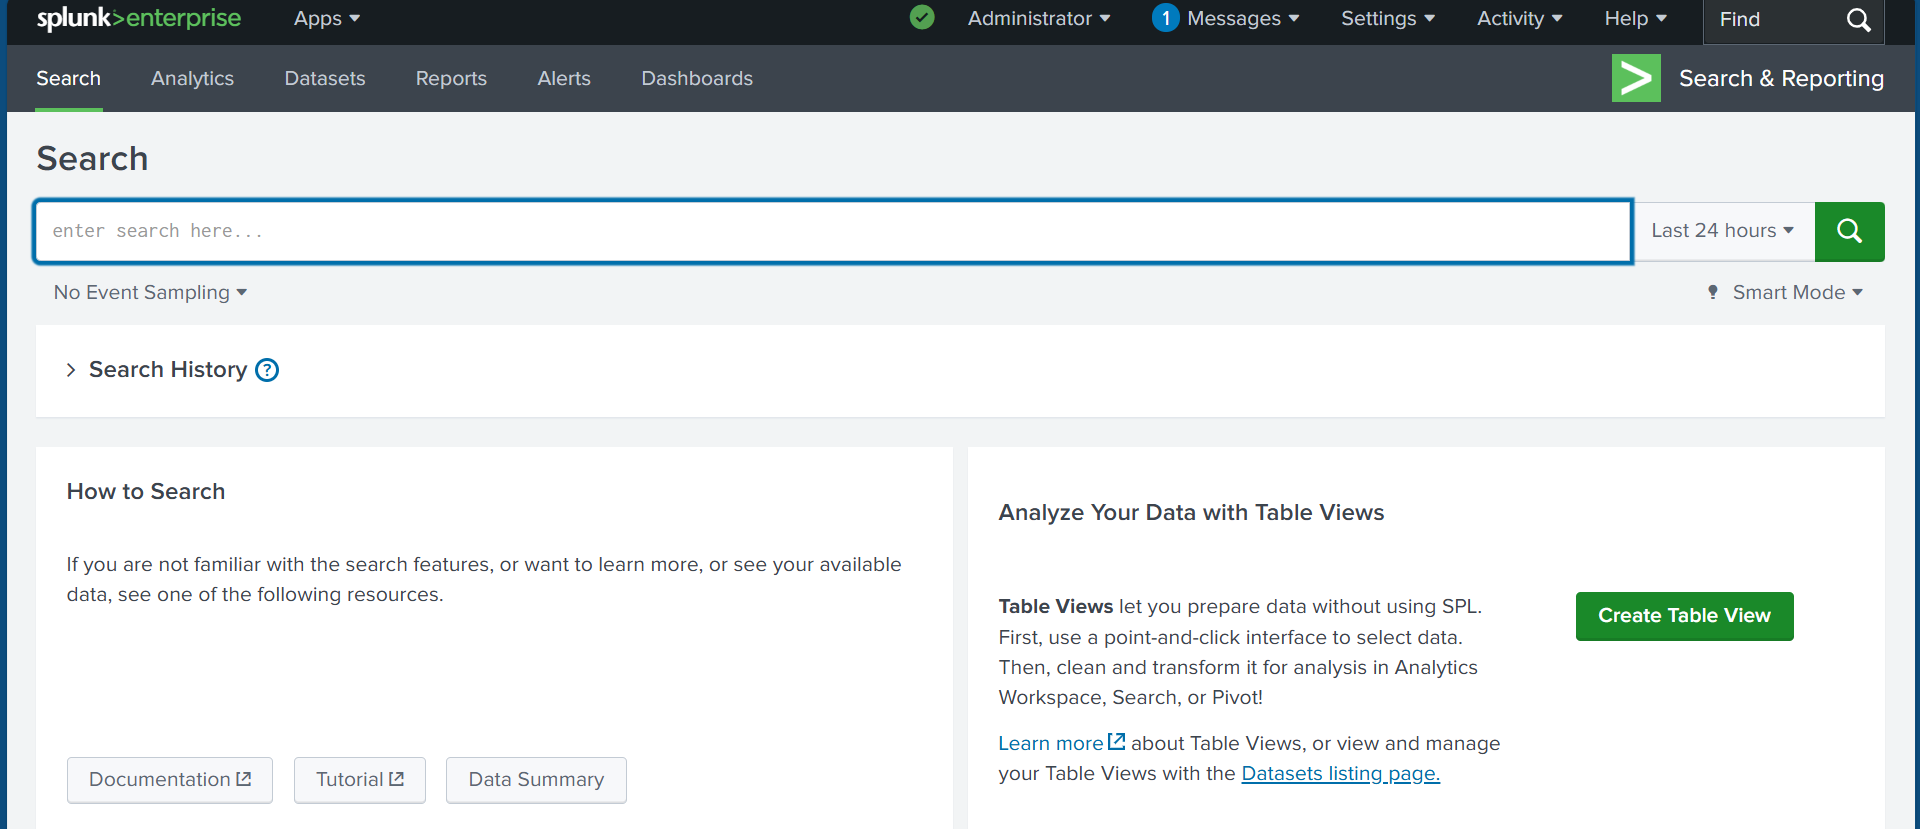
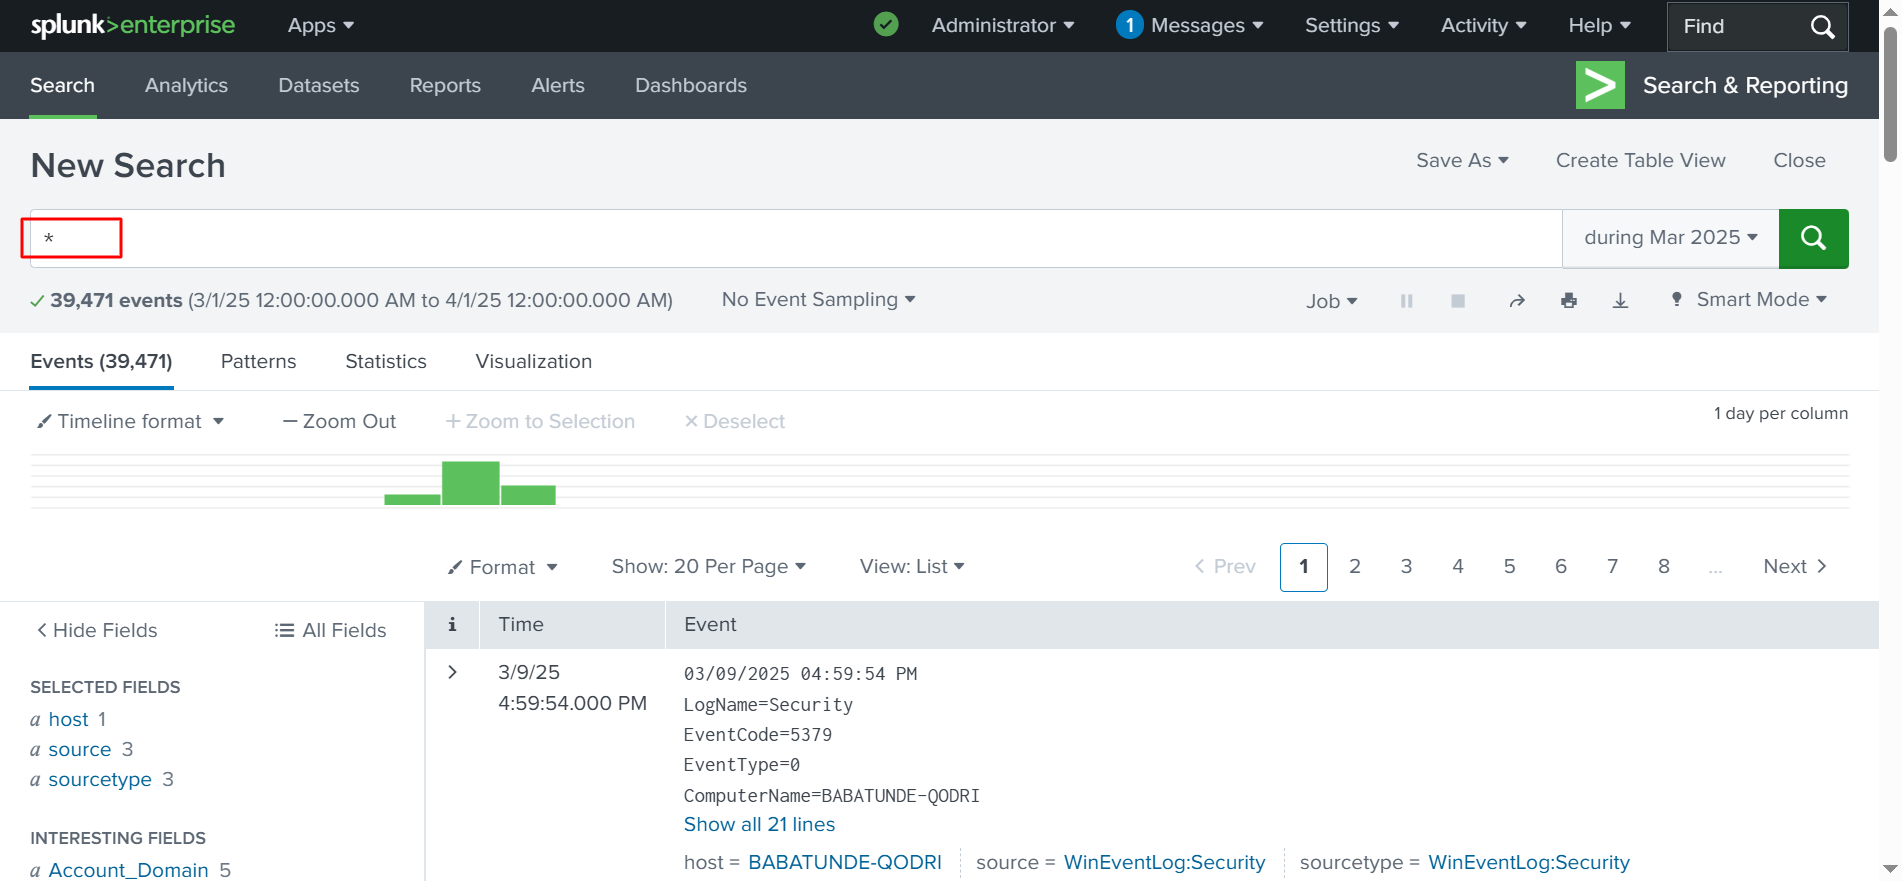
✅Step 6: In the search bar above, we enter an asterisk (*) and press Return to search for all available events. As shown in the screenshot below, Splunk is starting to retrieve events from our local system. We are only working with the local system, not a remote system. This is a basic search, but there are many advanced search options we can explore, such as filters, different queries, and parameters.
Steps 7.
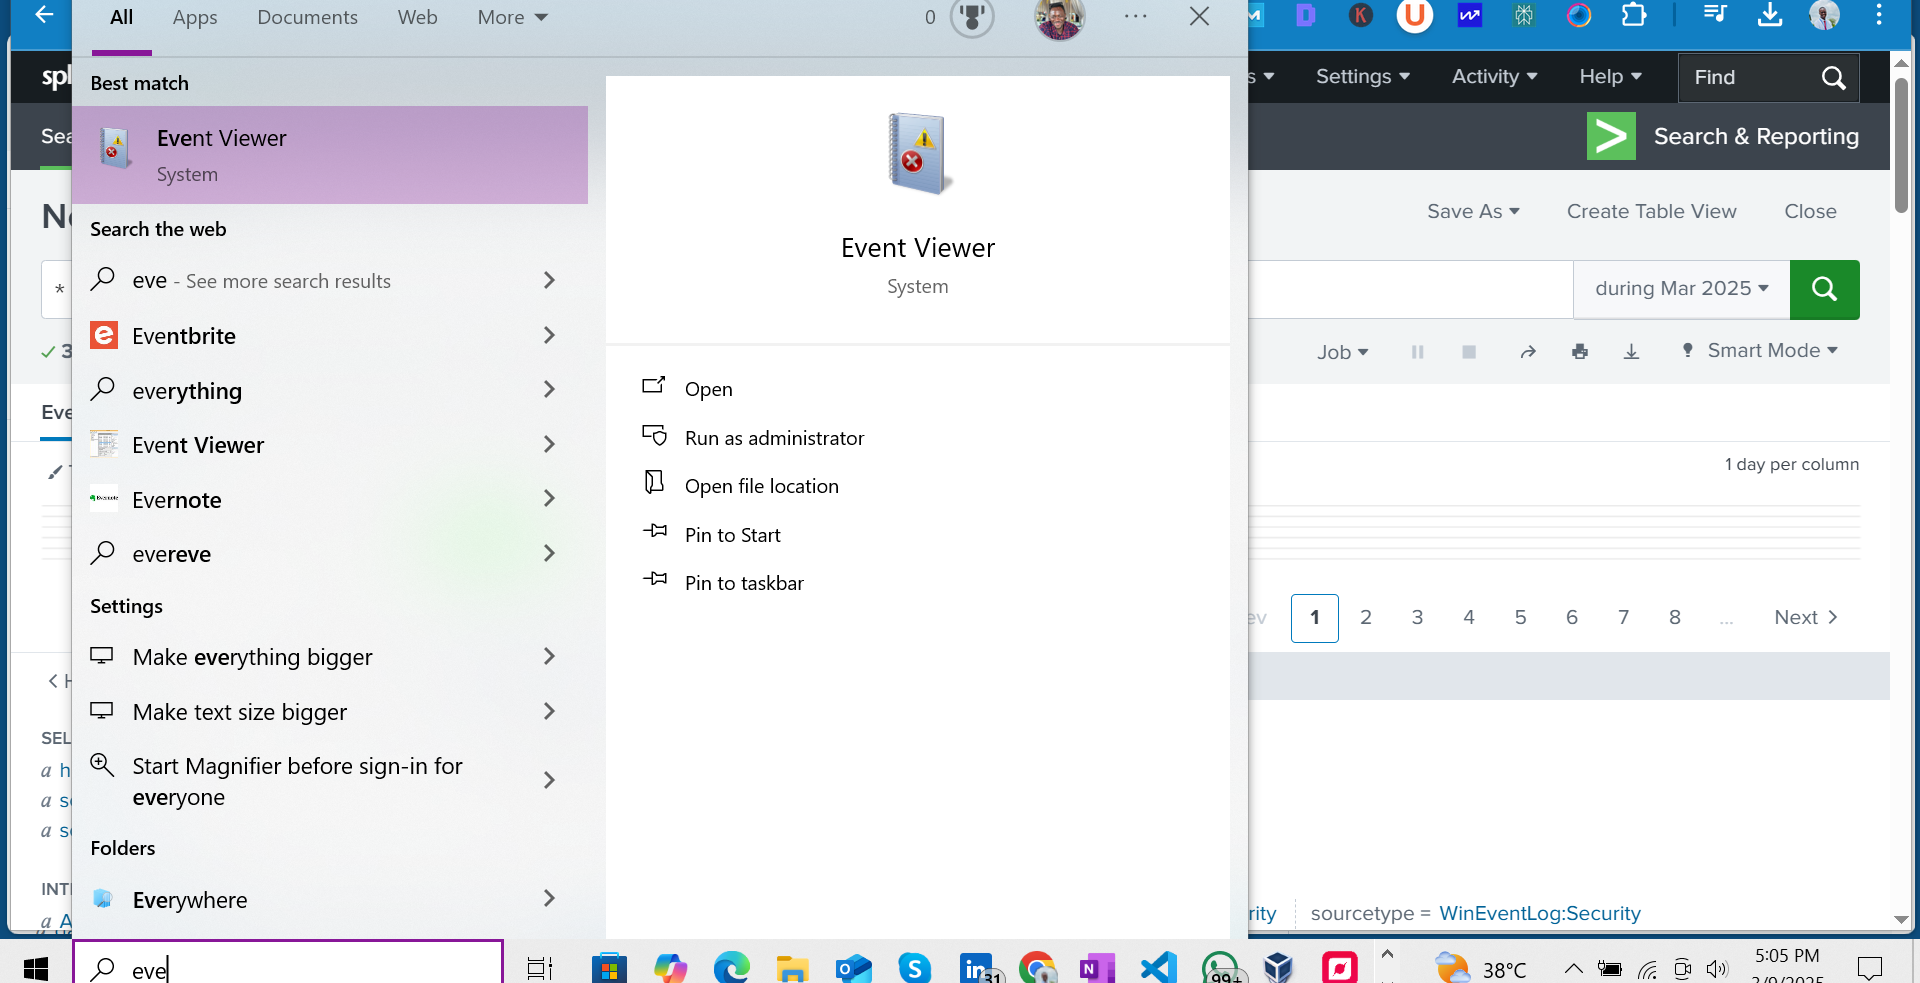
✅ Next, we will open the Event Viewer through the Windows menu.
✅ Go to “Windows Logs” and scroll down to “Security”, as shown in the screenshot below.
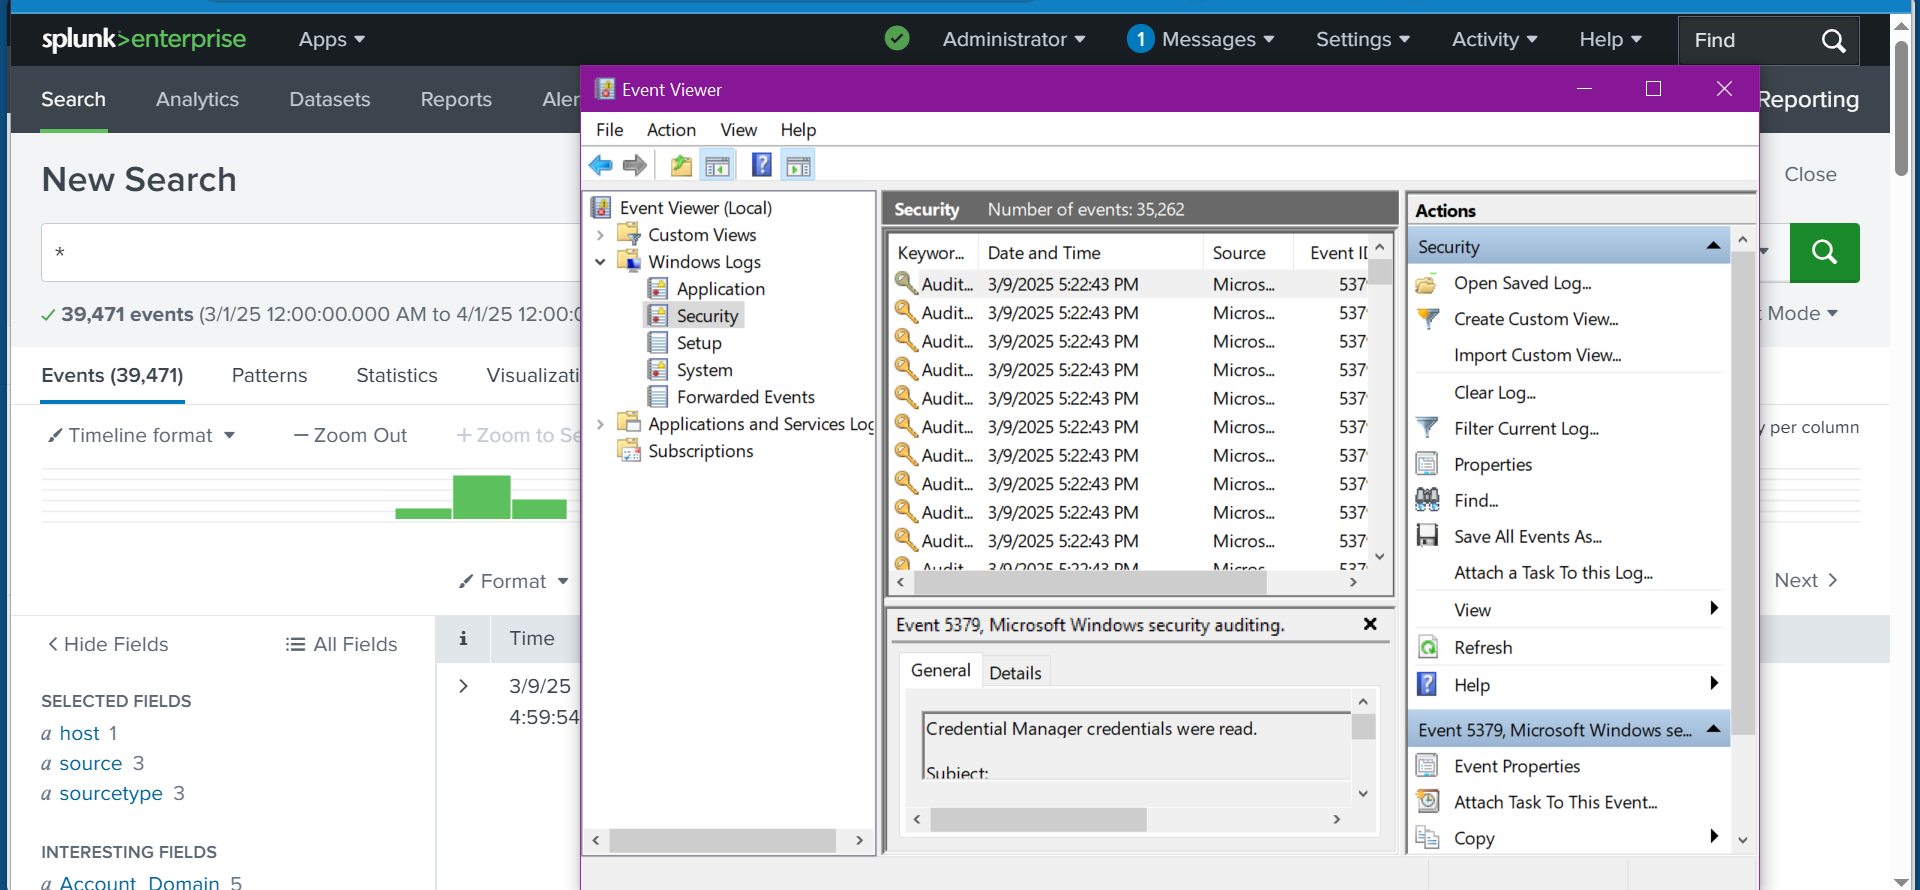
✅ Right-click on Security and select Clear Log.
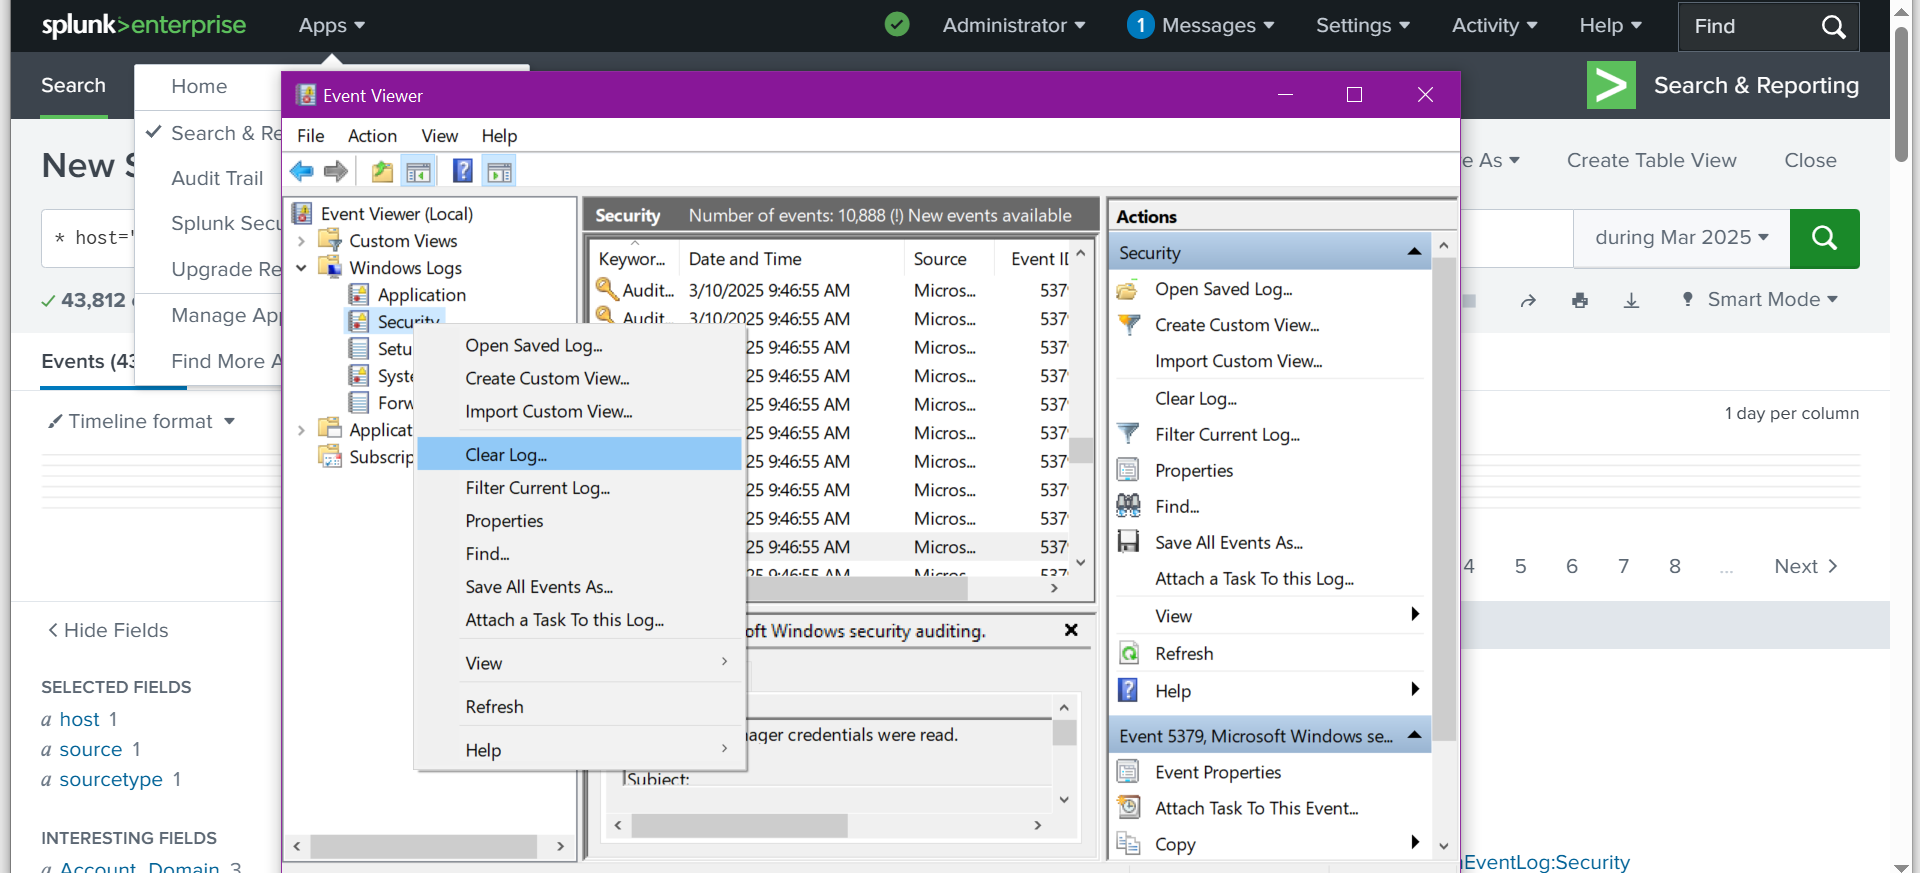
✅ I am going to clear the Security log. Here’s why: If we go back to our Splunk system, for example, the host we choose will be added to the search, including the selected parameters and fields. 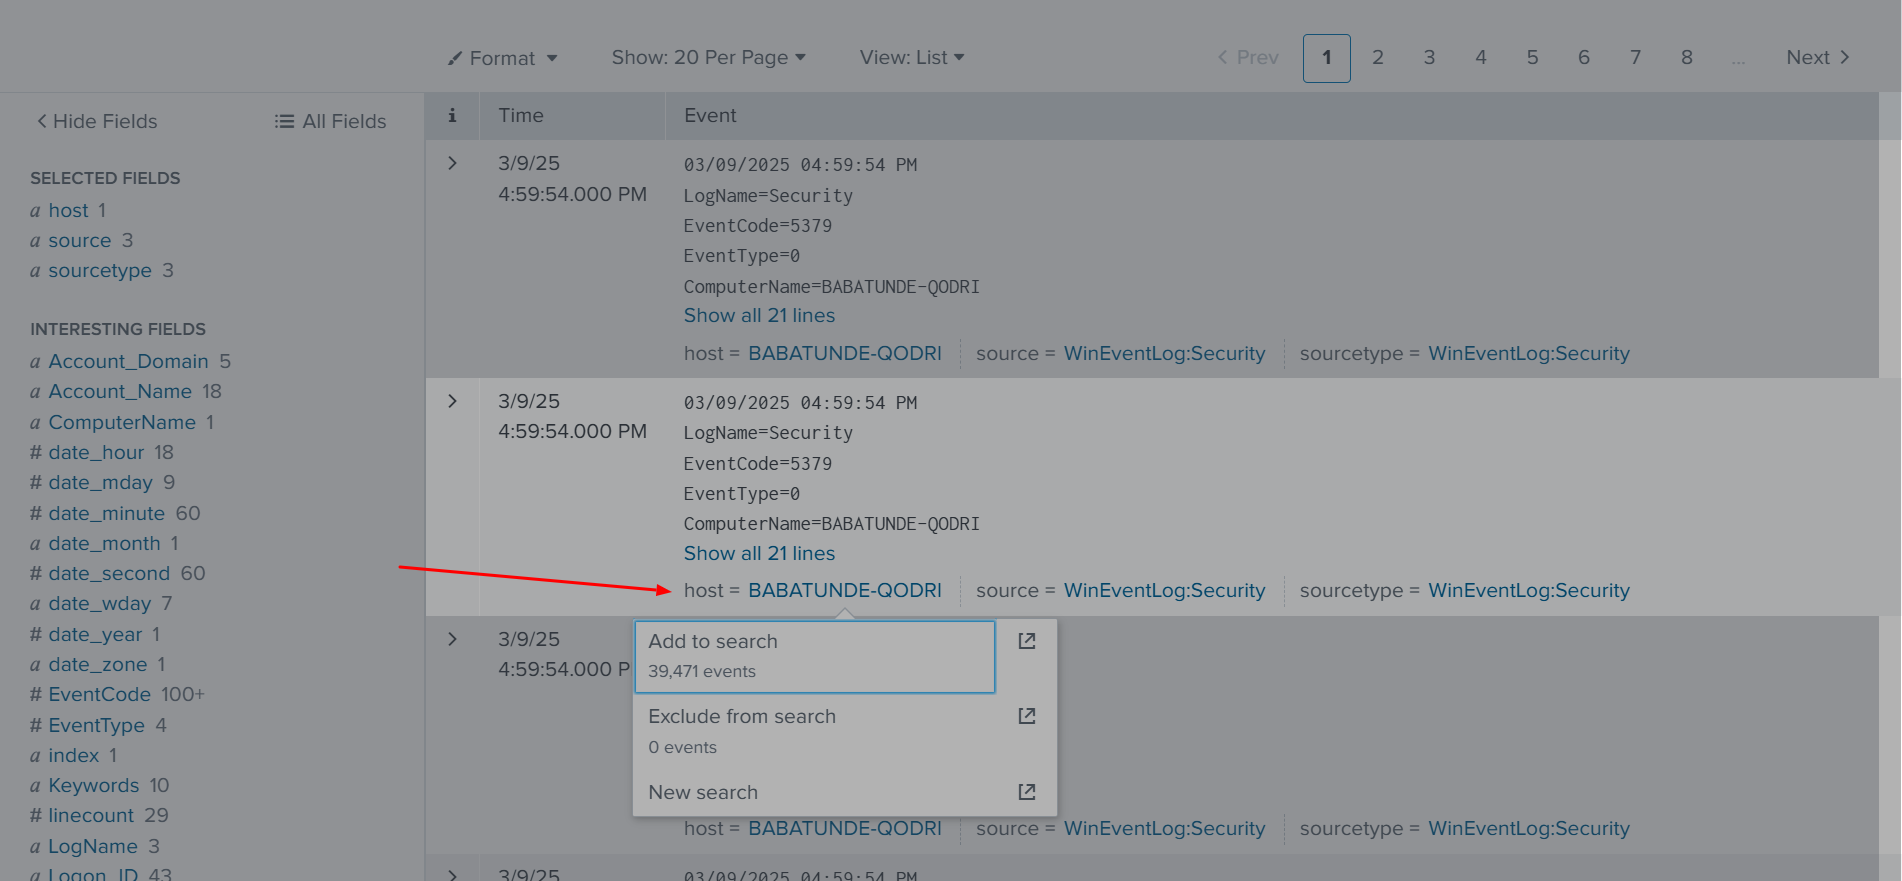
✅ As seen in the image above, we will left-click on the host to Add to Search, which will then be added to the search bar.
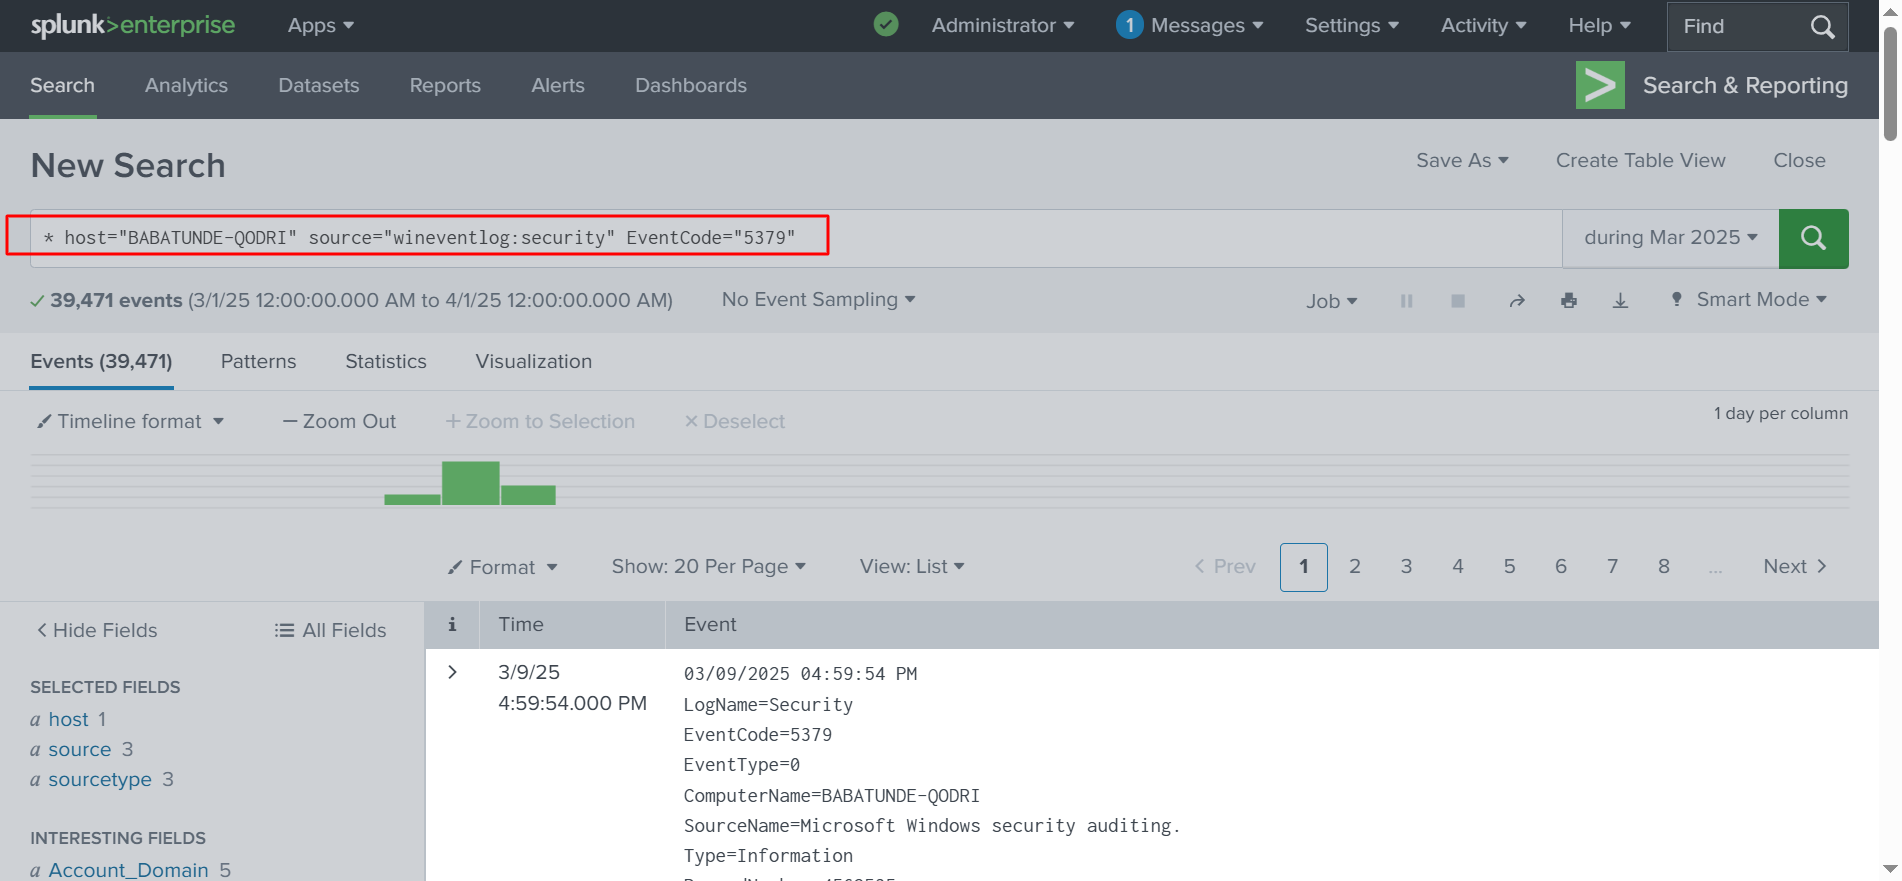
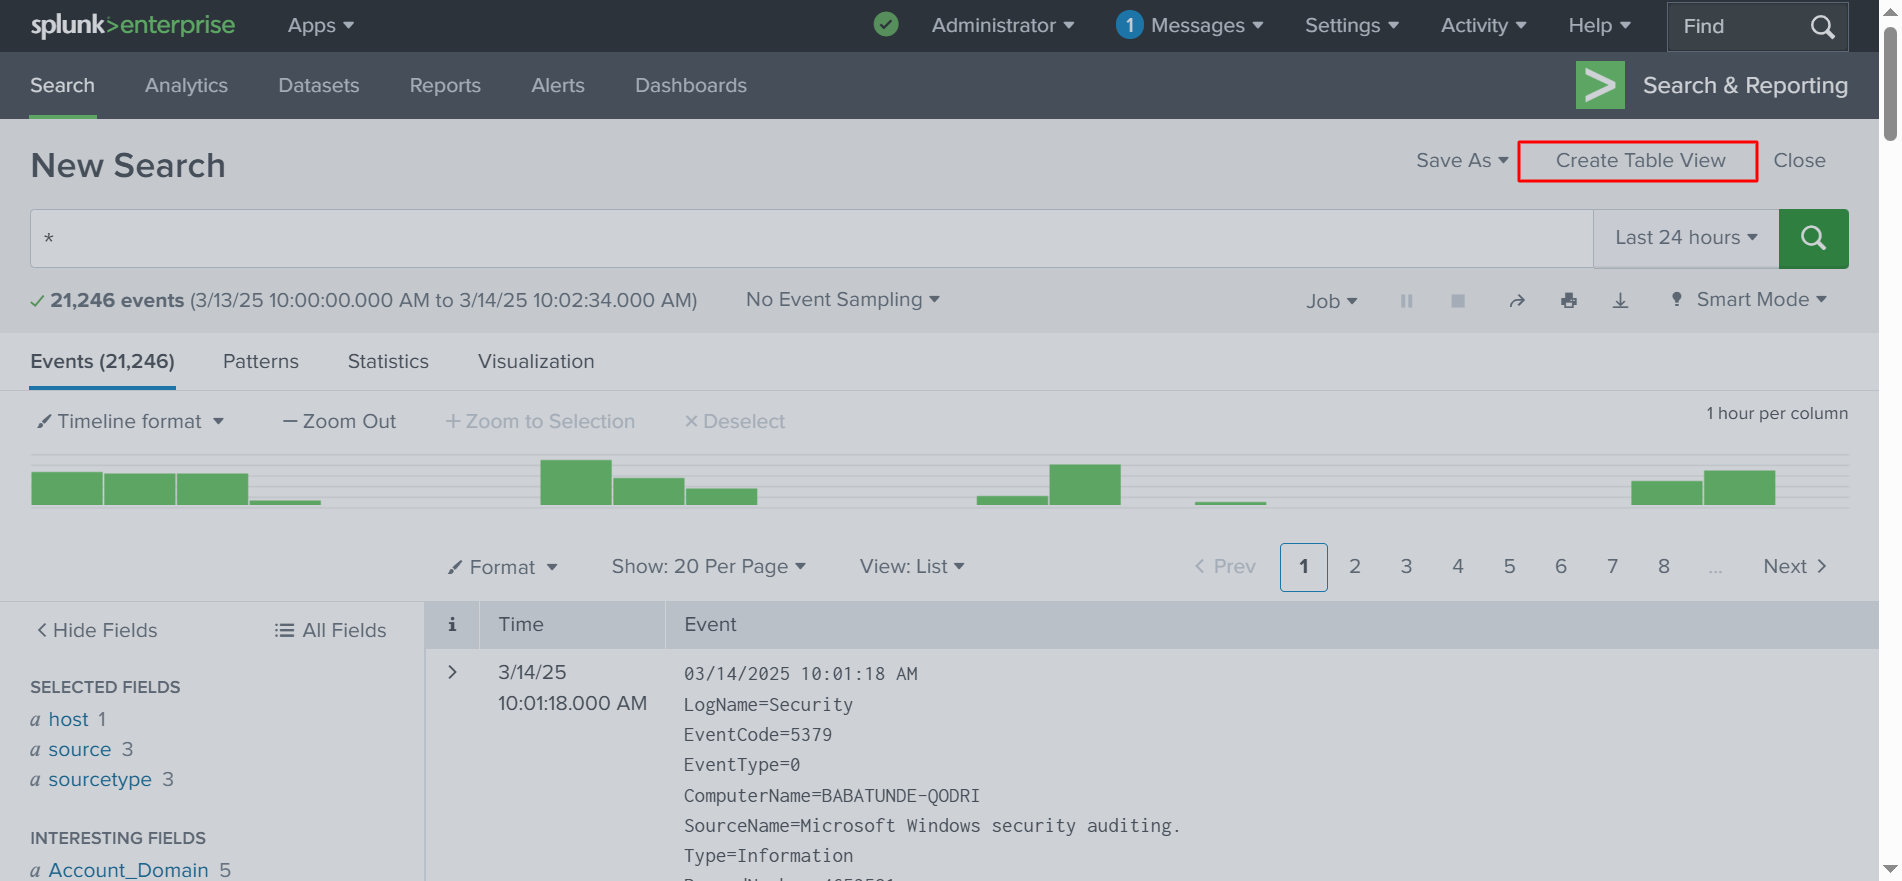
✅ We are going to add: host=Babatunde-Qodri source=”wineventlog:security” EventCode=”5379″ in the search bar. Adding EventCode=5379 specifies the event we want to find. Then, we press Return. This is a simple way to narrow down the search.
✅ Steps:
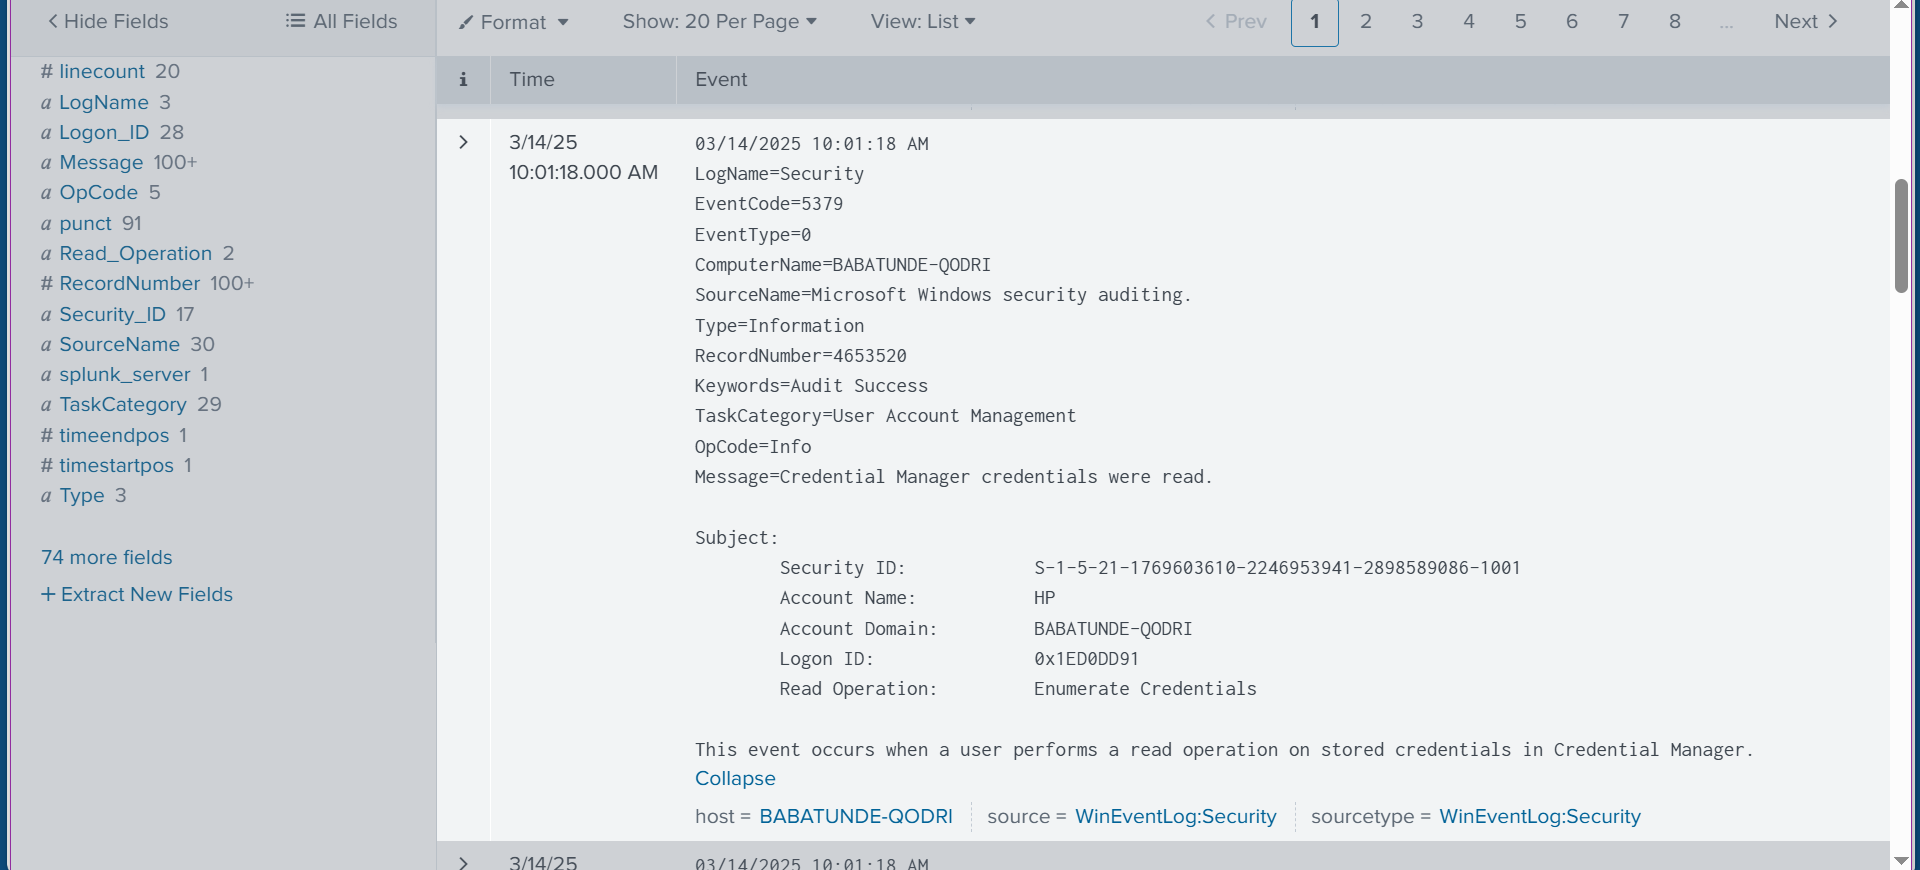
This event shows that the audit log has been cleared, which is exactly what we just did. This is a typical example of how I search for specific events in Splunk. Next, we need to copy the information in the search bar, as we will need it later.
✅ The next step is to create a table view, then skip the tour.
✅ This will generate a table, as shown below, which includes ‘Source Types’ and ‘Raw’ data. On the side of the view, you can select or deselect different types of logs. I am going to unselect ‘Raw’ so that it does not display all that information. 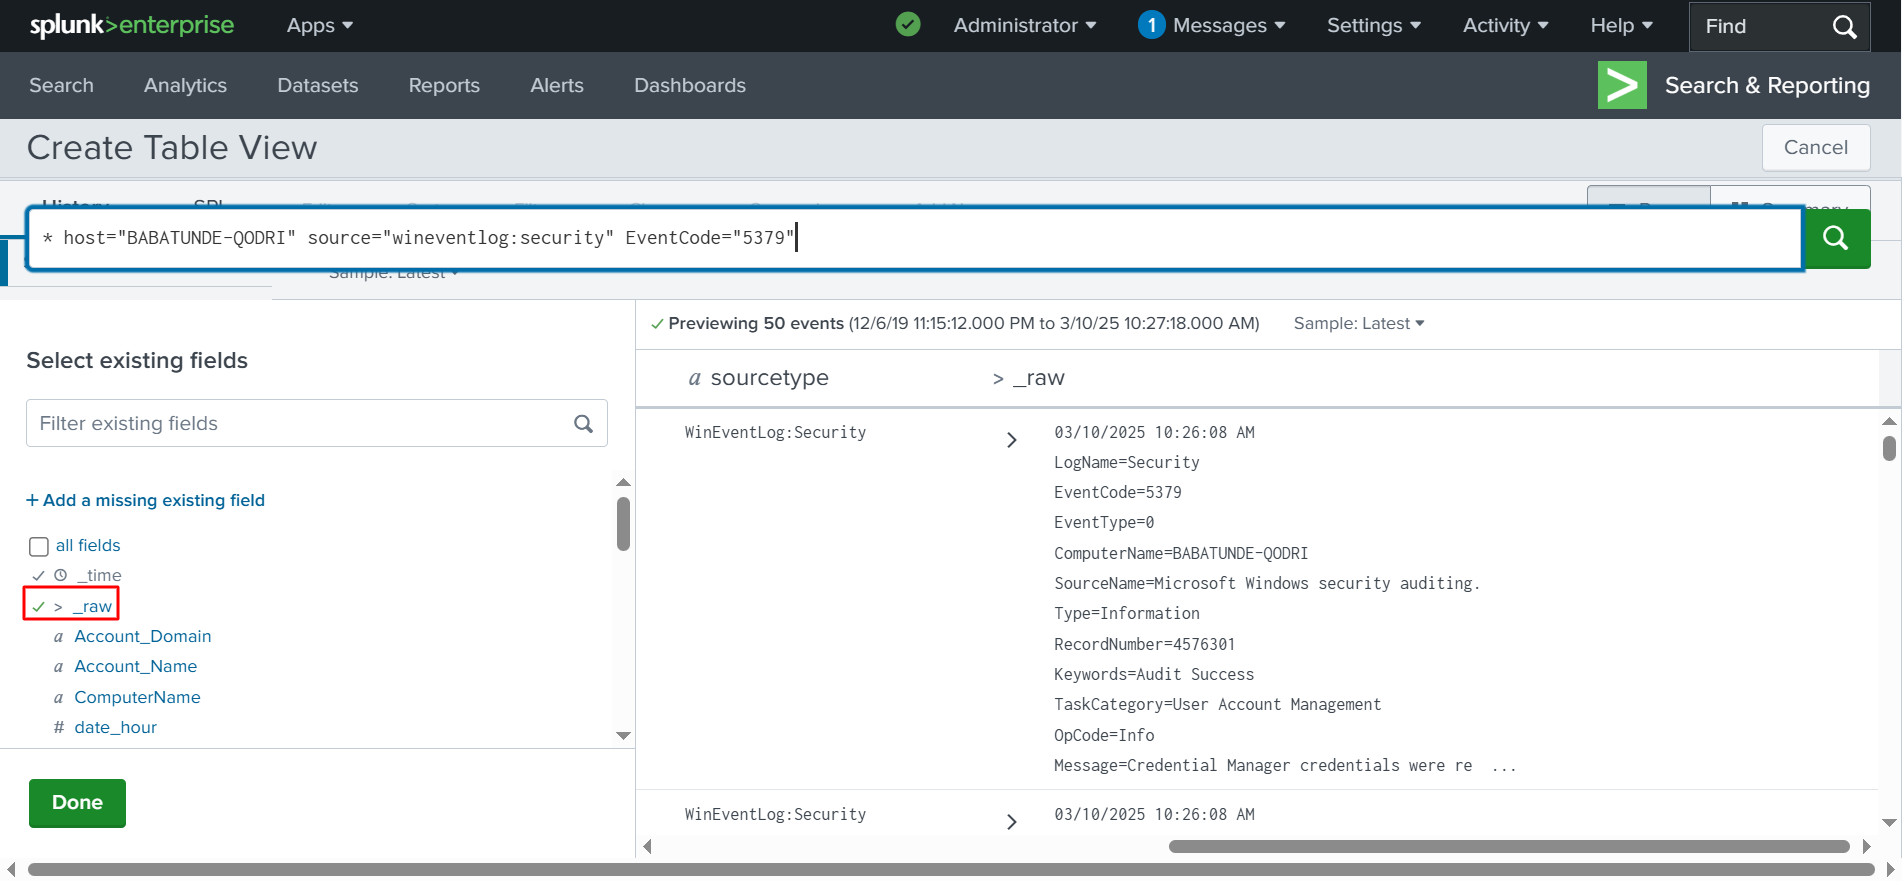
✅ Click _raw to unselect it, then click Done, as shown in the screenshot below.
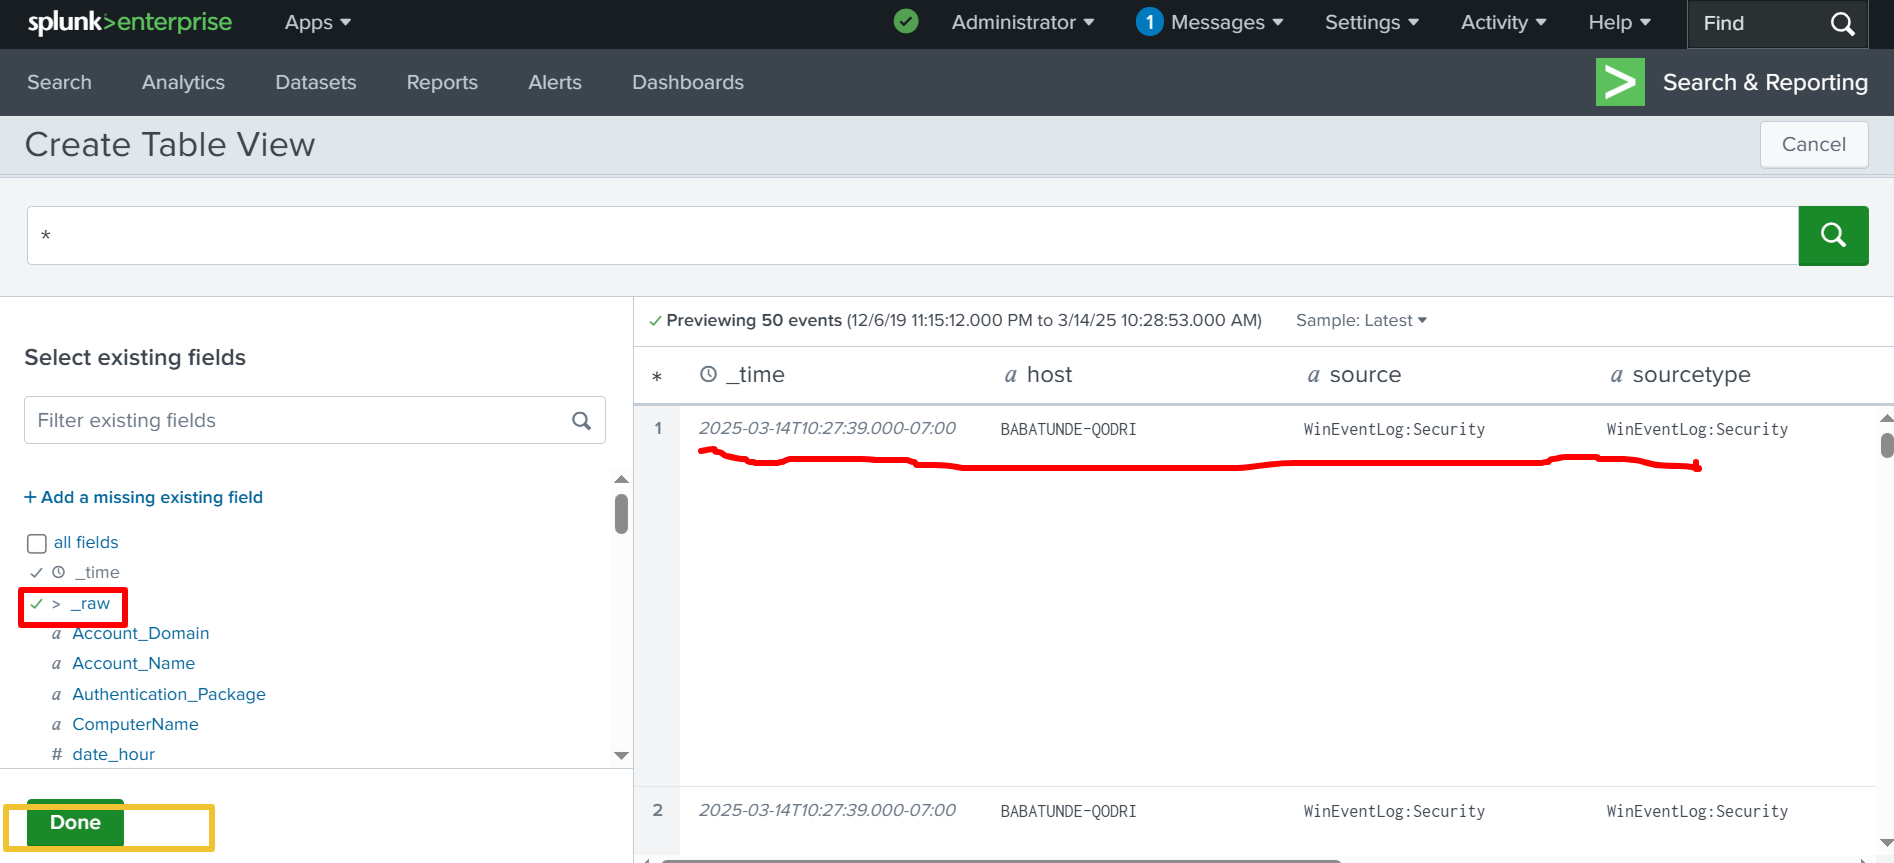
✅ After I click Done, a table is generated with the exact fields I selected. Then, I navigate to the Dashboard and create a new dashboard from the top right side of the screen. 
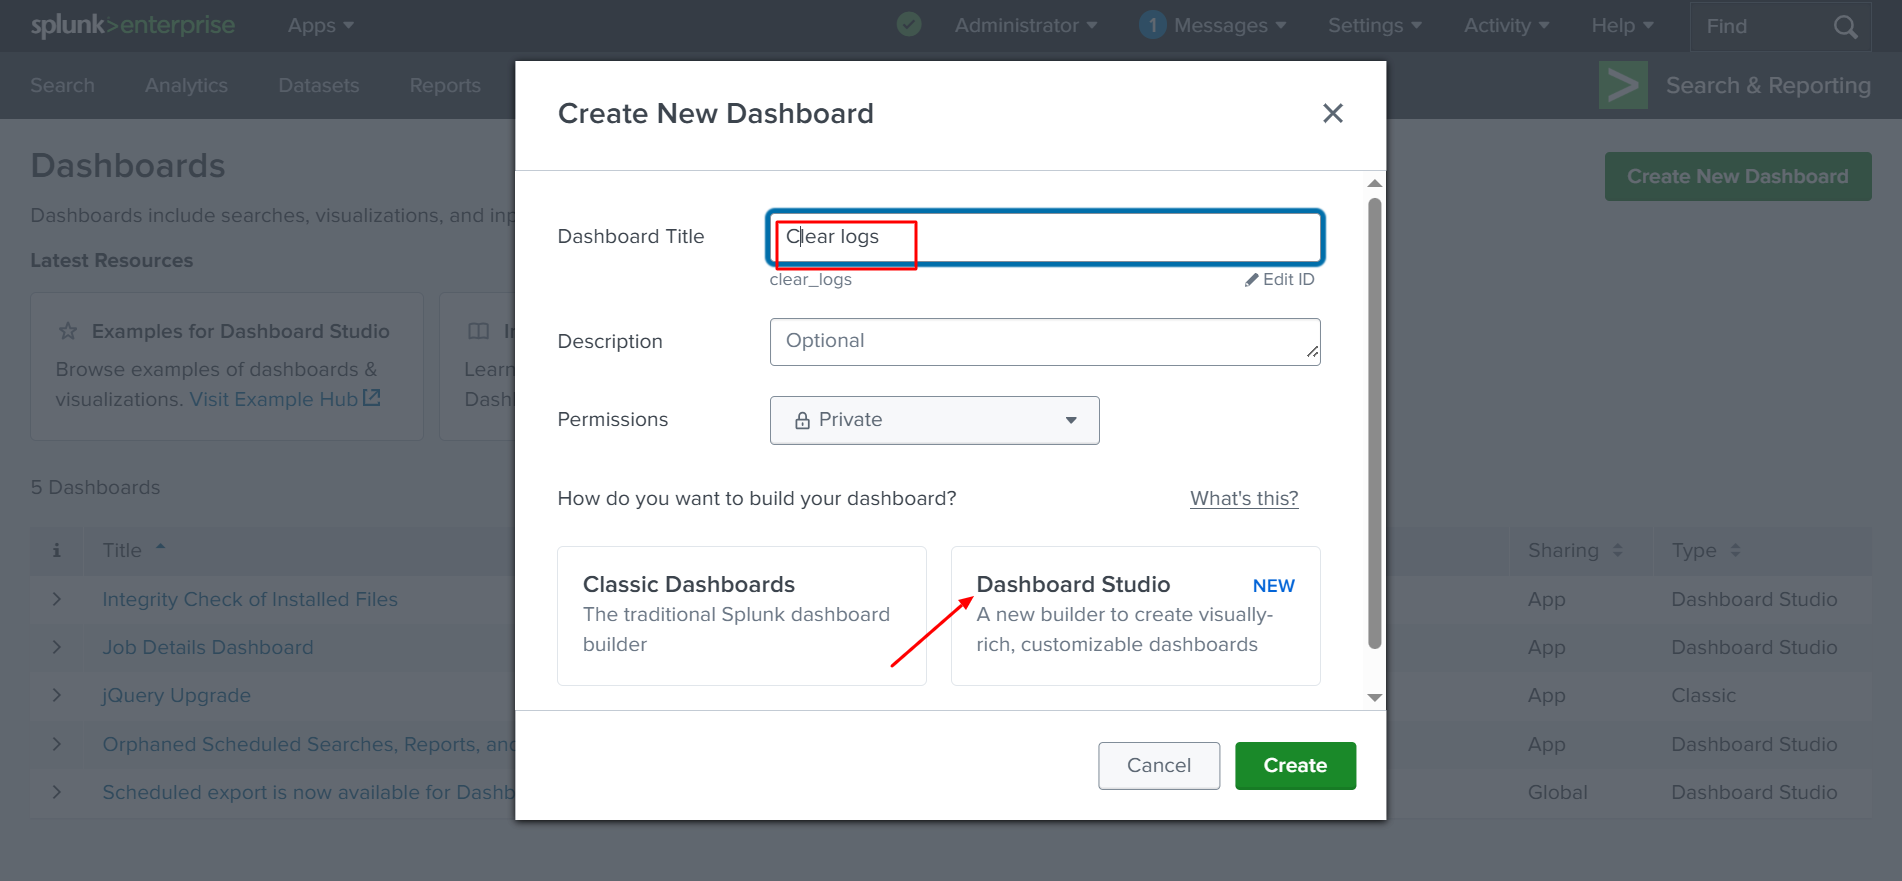
✅ Click Create New Dashboard from the top right corner of the screen, as shown in the screenshot below. 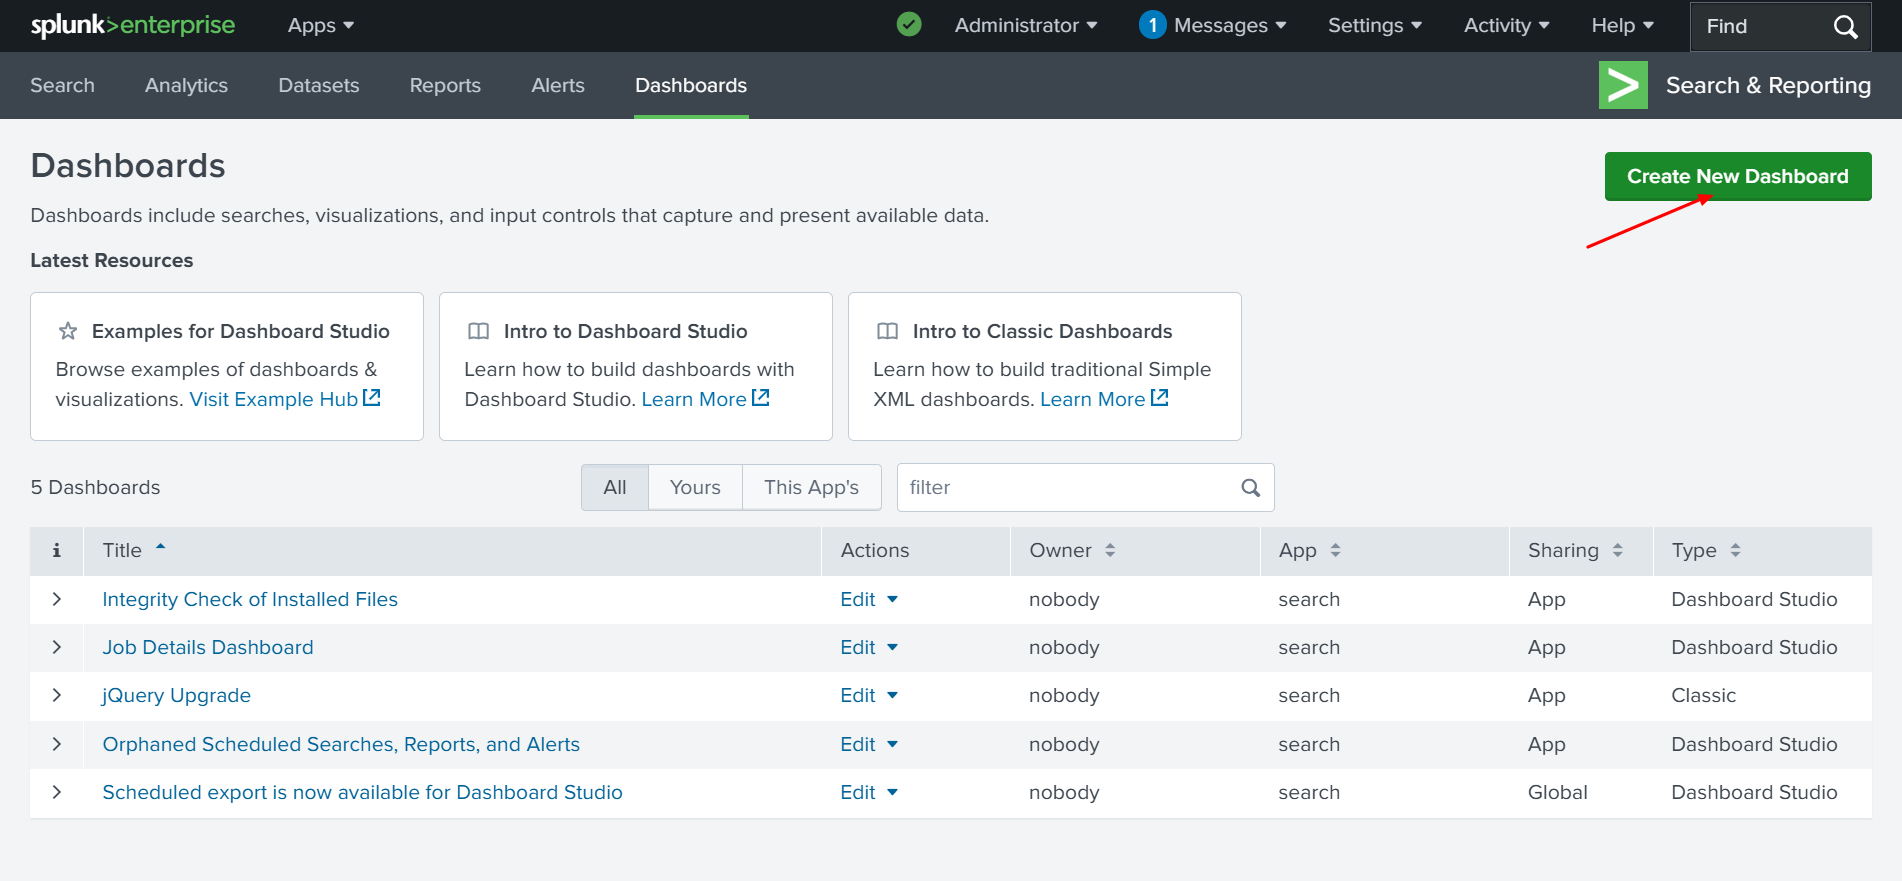
✅ After clicking Create New Dashboard, you will see an option to label it. We will name it “Clear Logs”, then click Create and select Dashboard Studio.
Select Grid layout model. And finally click “create” 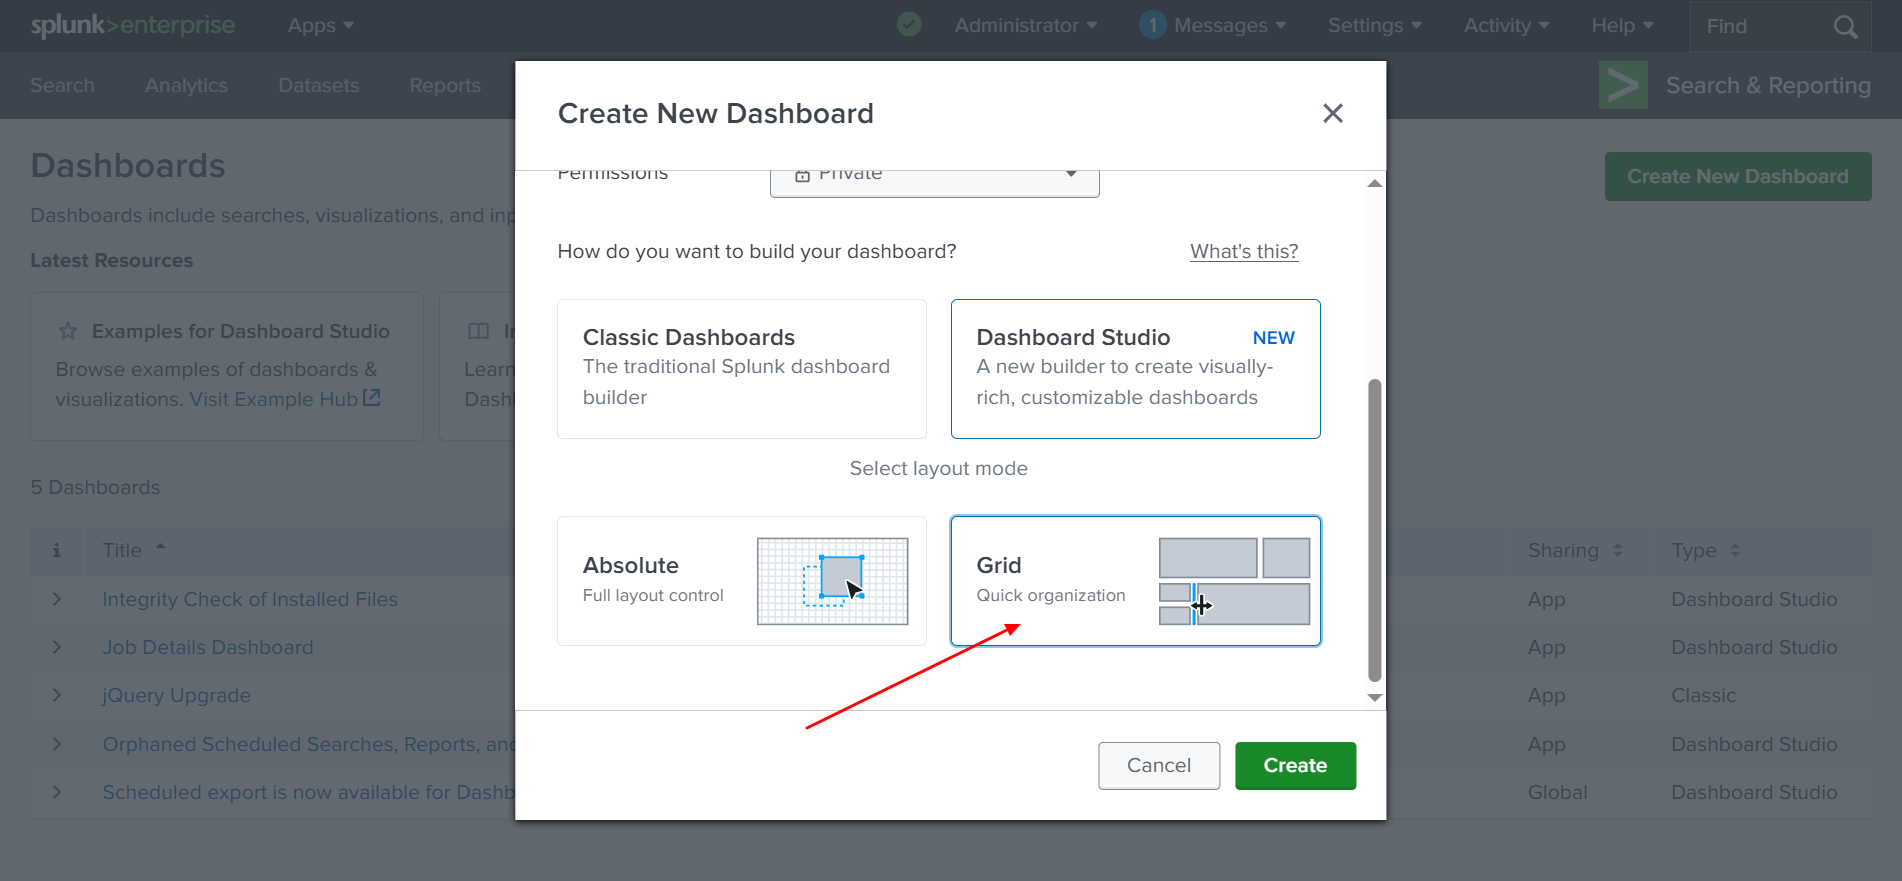
✅ Let’s create a dashboard. A dashboard is highly useful and suitable for analyzing data because it can quickly display important information, especially in areas like security, IT, and data analytics. It allows us to organize data in tables or graphs, making it easy to monitor and analyze events in real time.
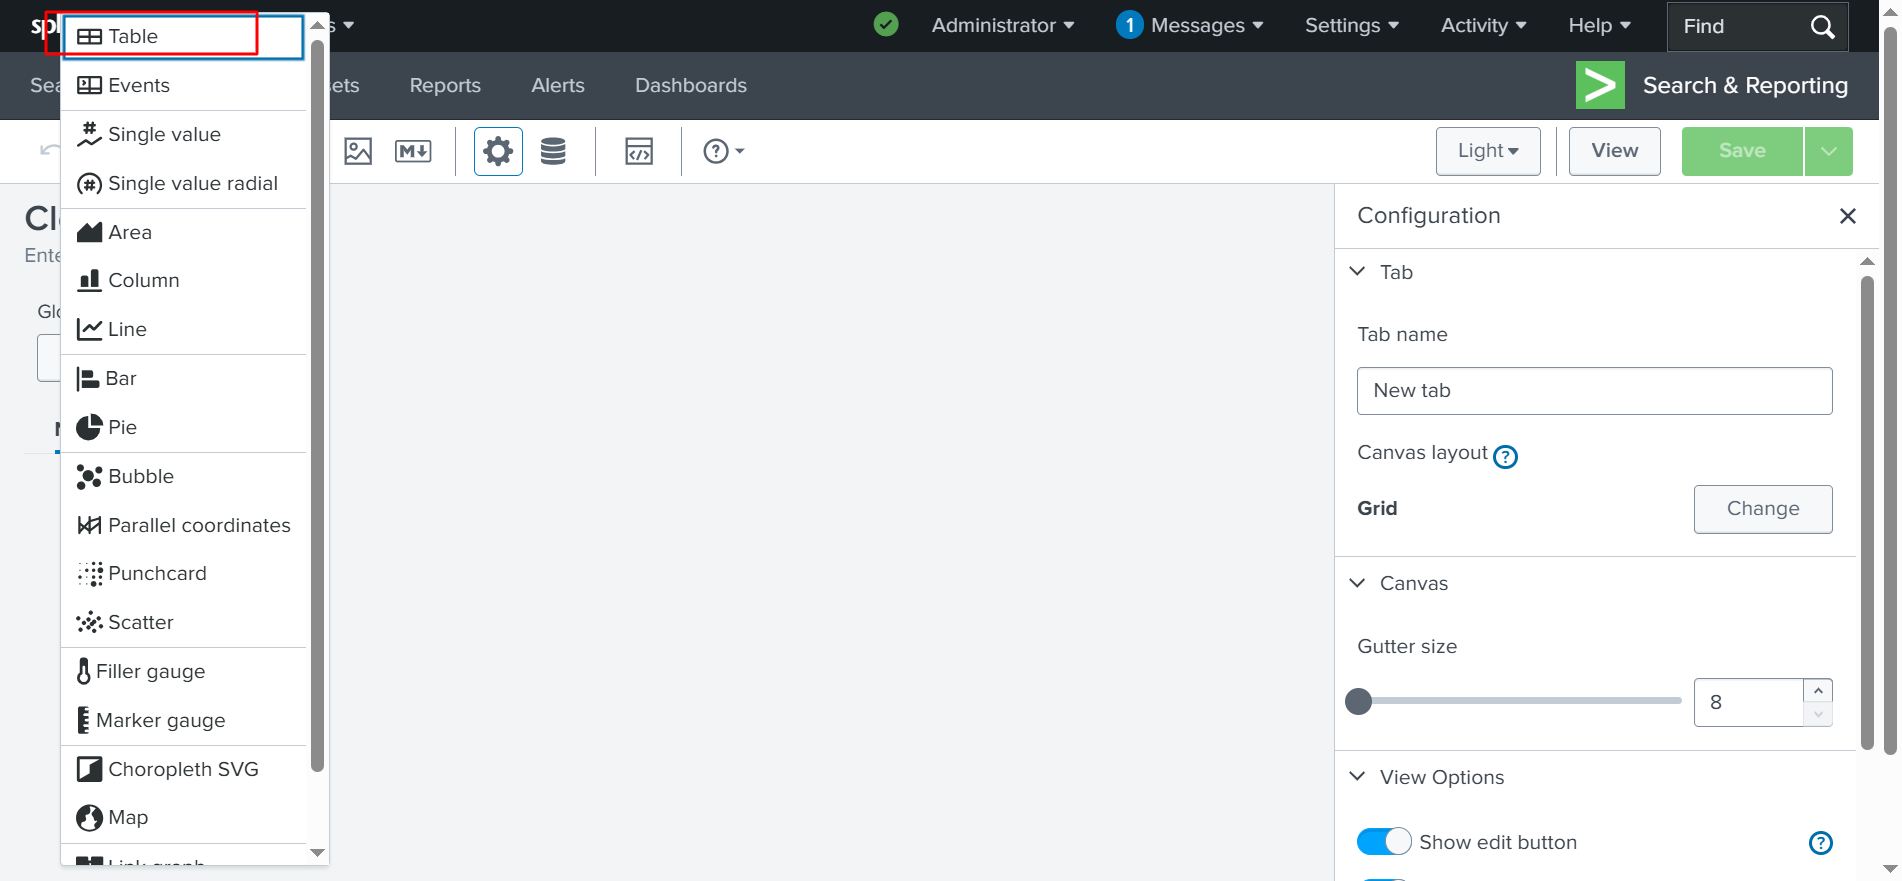
✅ LET’S ADD A CHART: First, we are going to add a table, as shown above. Then, we will paste the copied query:
host=BABATUNDE-QODRI source=”wineventlog:security” EventCode=”5379″
Next, we paste the search into the SPL query, as shown in the screenshot below.
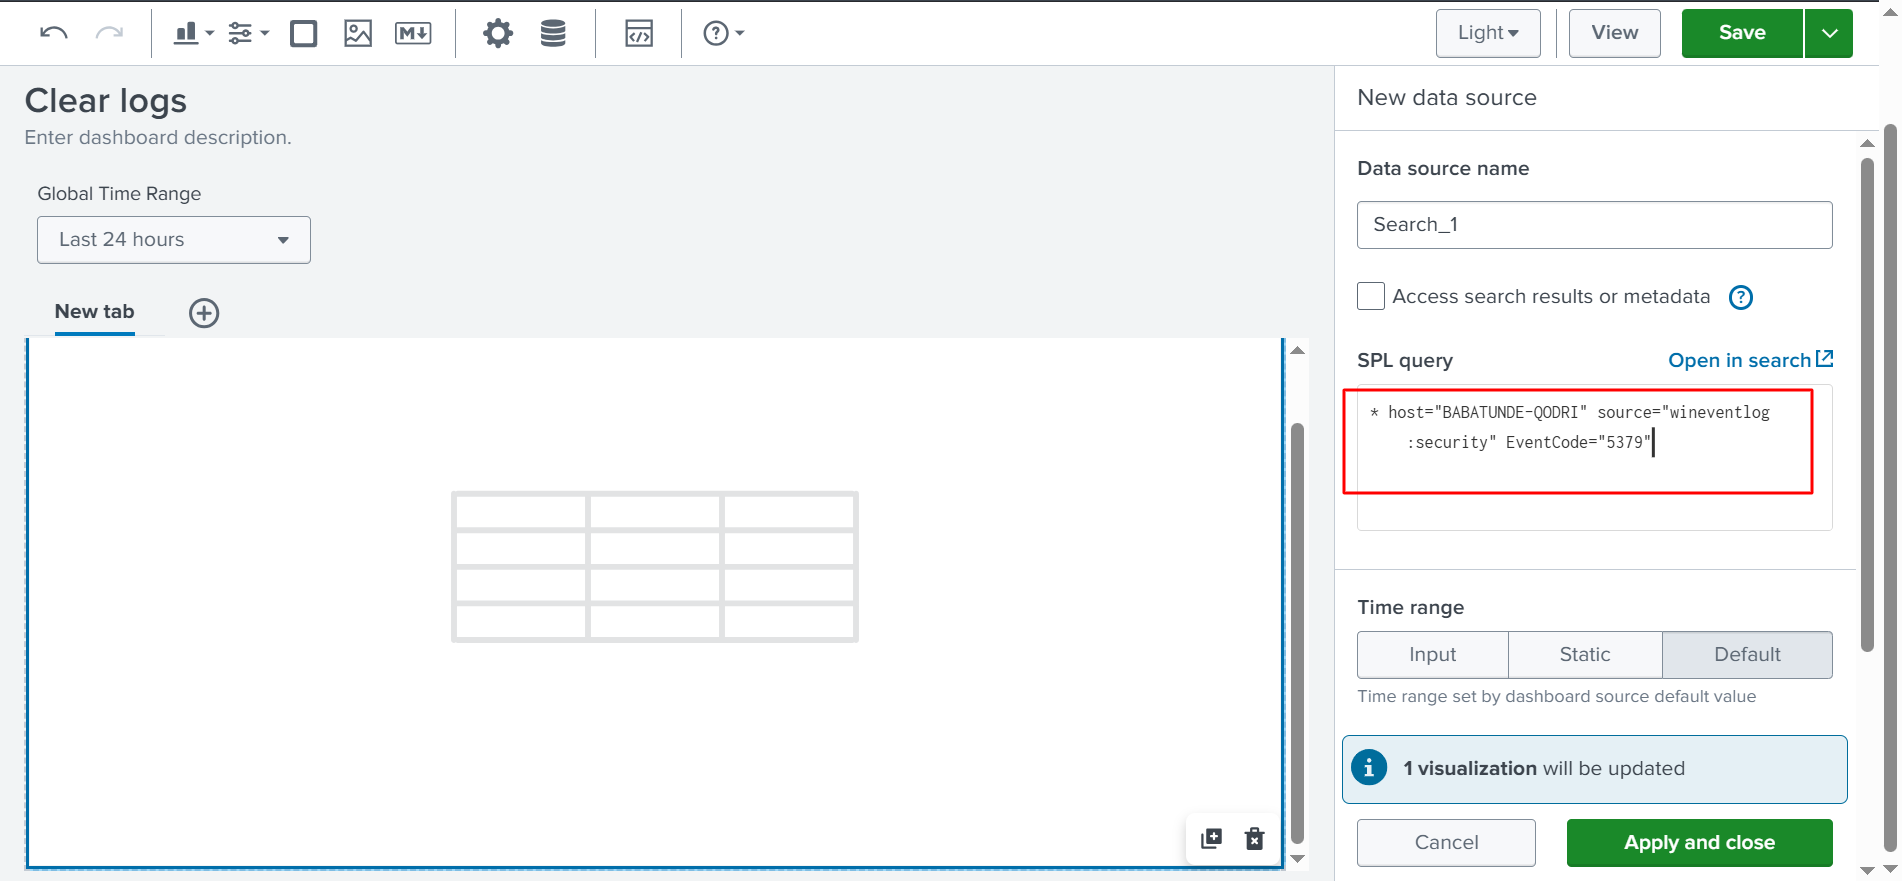
✅ The SPL query is already set to find the event logs that were cleared, and it looks exactly like it did in our previous search. Finally, we will select Apply and Close, as shown below. 
✅ After this, we are not going to customize it further, but you could do so in the Column Formatting section. You can add or remove elements as needed. 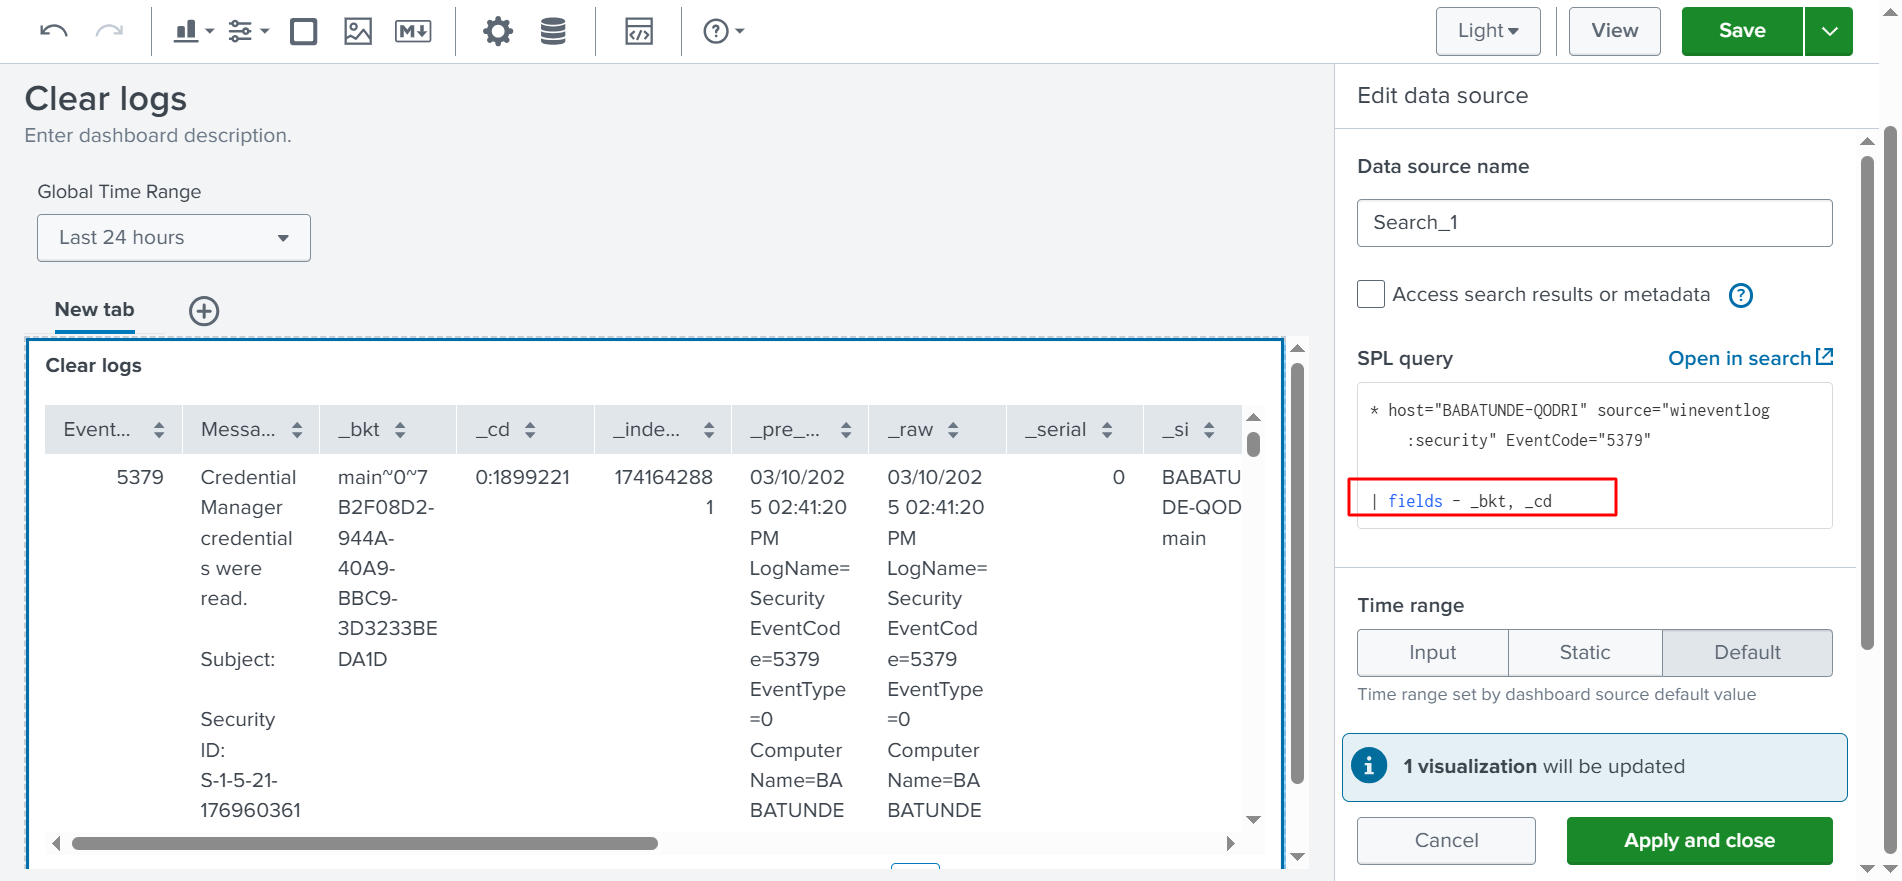
✅ If we scroll up, we can edit our search. I also removed some columns that I didn’t need. To do this, I added a pipe (|) in the query, as shown in the image above:
| fields – bkt, cd
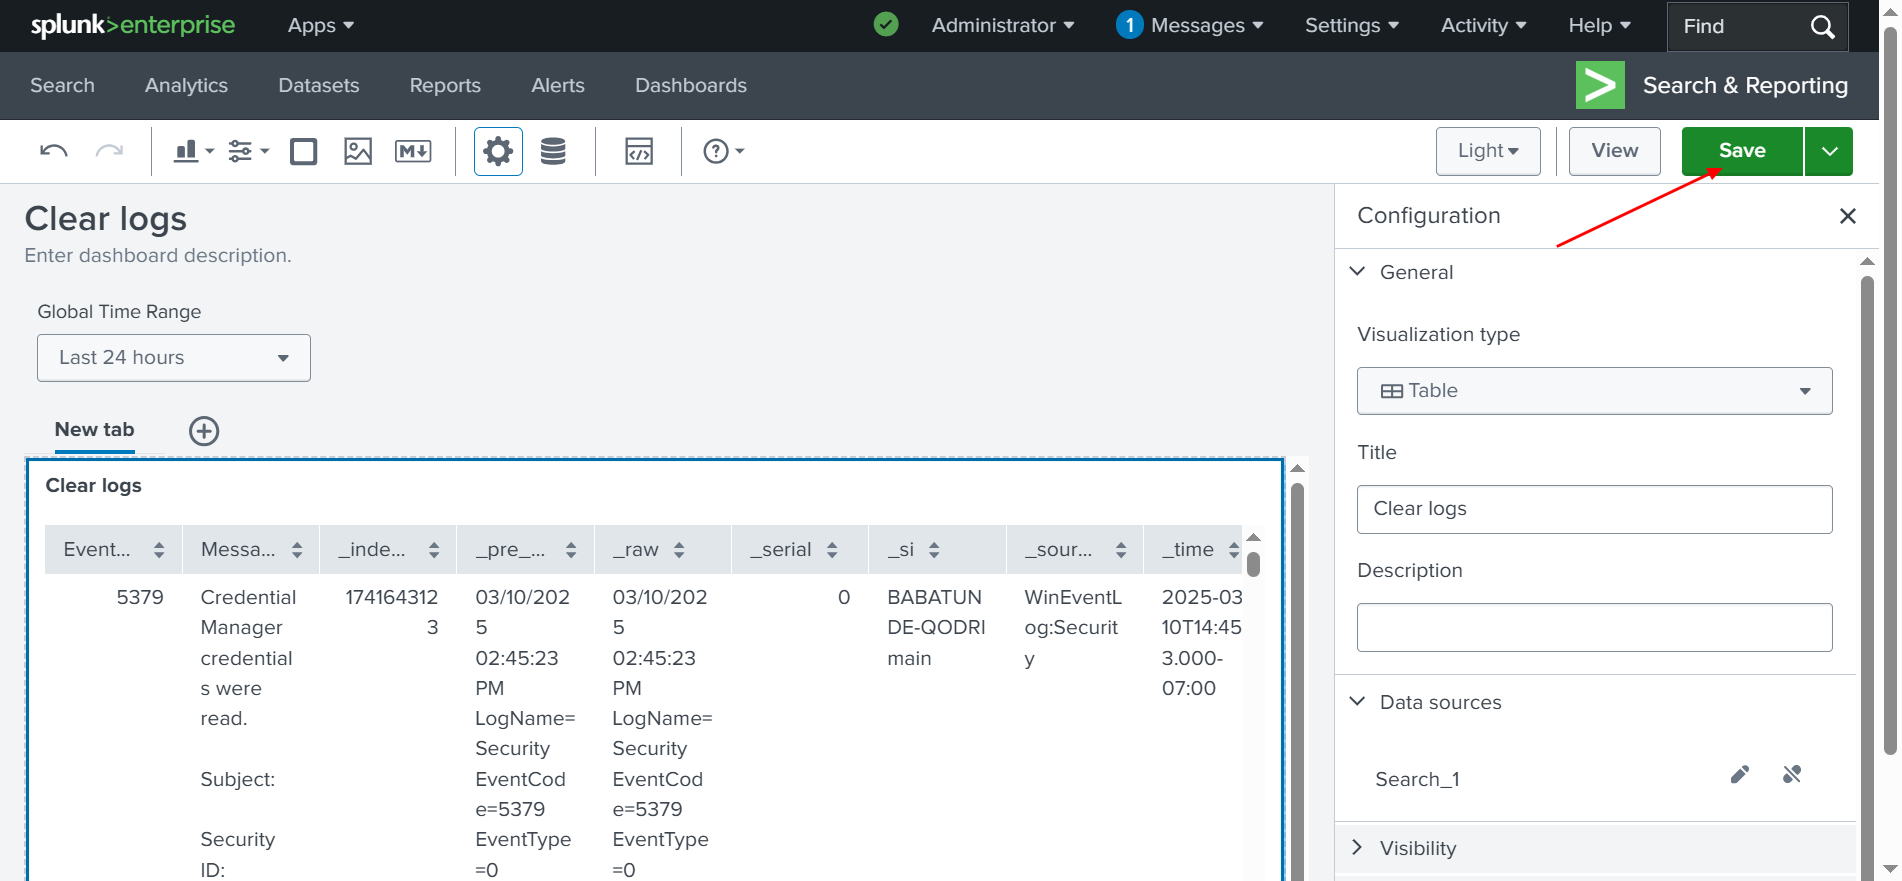
This eliminates the selected columns. Next, we will select Apply and Close. As you can see, these columns are no longer present. You can fully customize the table to your preference. Finally, we will select Save to this Dashboard to ensure the table is saved.
✅ Now, we are going back to our dashboard. After clicking Dashboards, you will see that our dashboard is now available no matter where you are within the application. 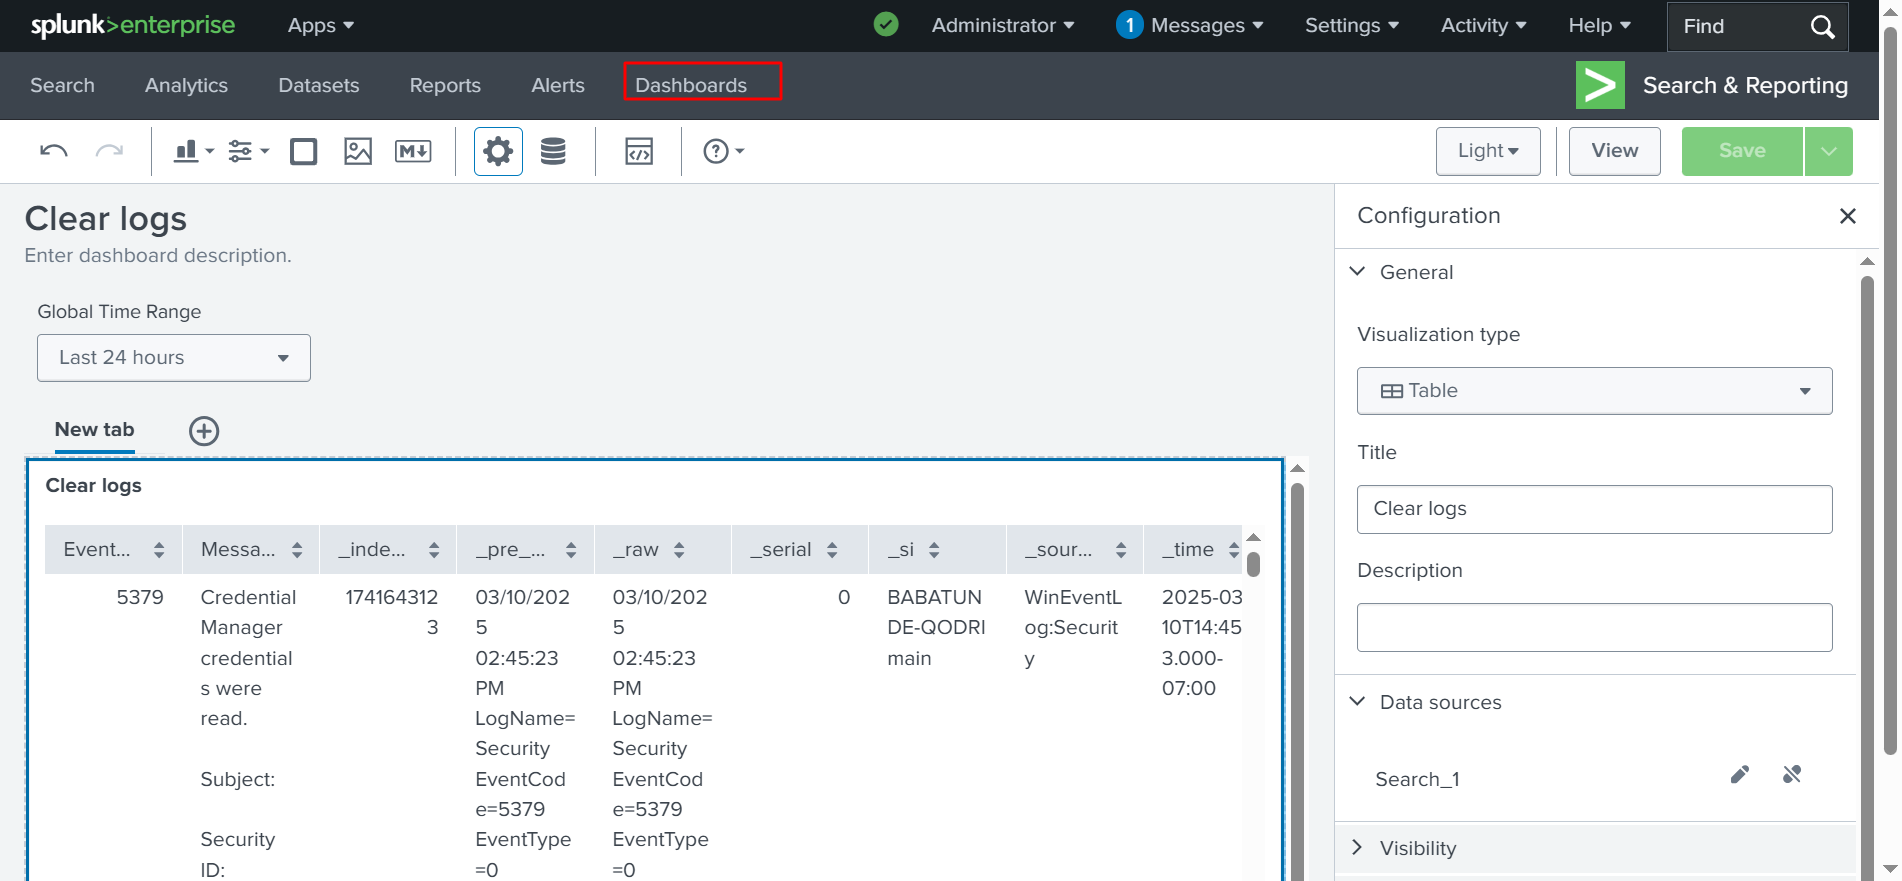
✅ Here is the graphical interface of our dashboard below. However, we still need to click on the dashboard we created, Clear Logs, to open it.
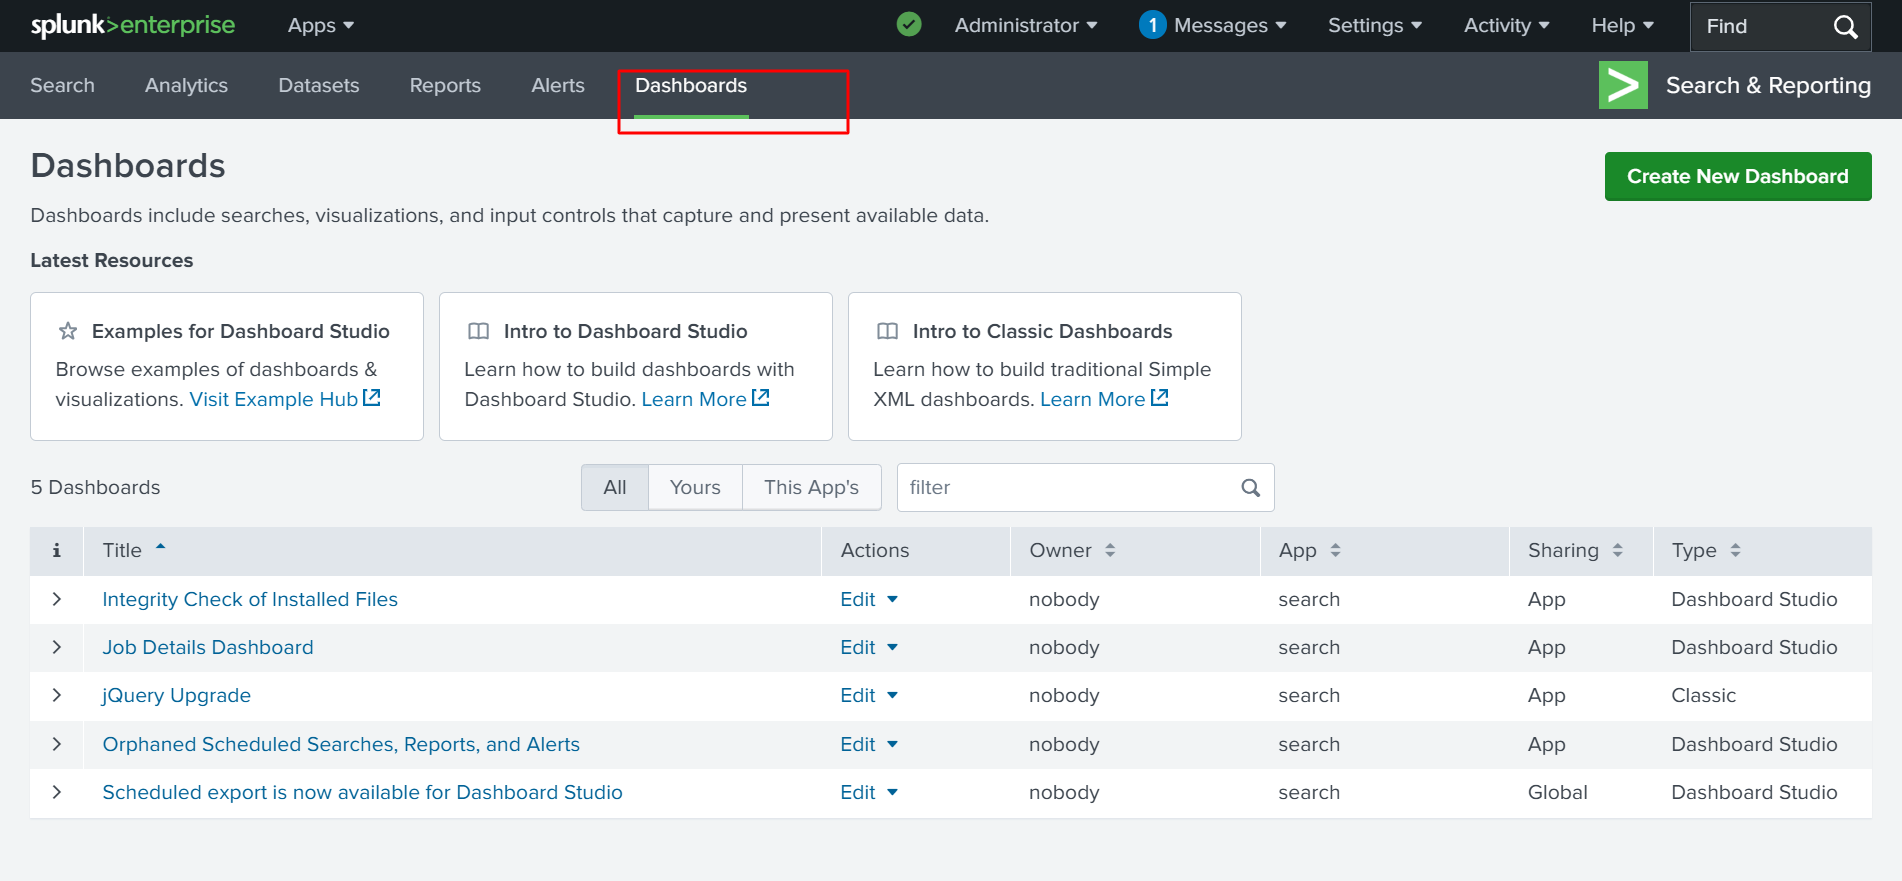
✅ This is the table we created. Next, if we go to Actions, we will set it as the home dashboard. This will make it our primary dashboard, and it will be available under Search & Reporting in the application. 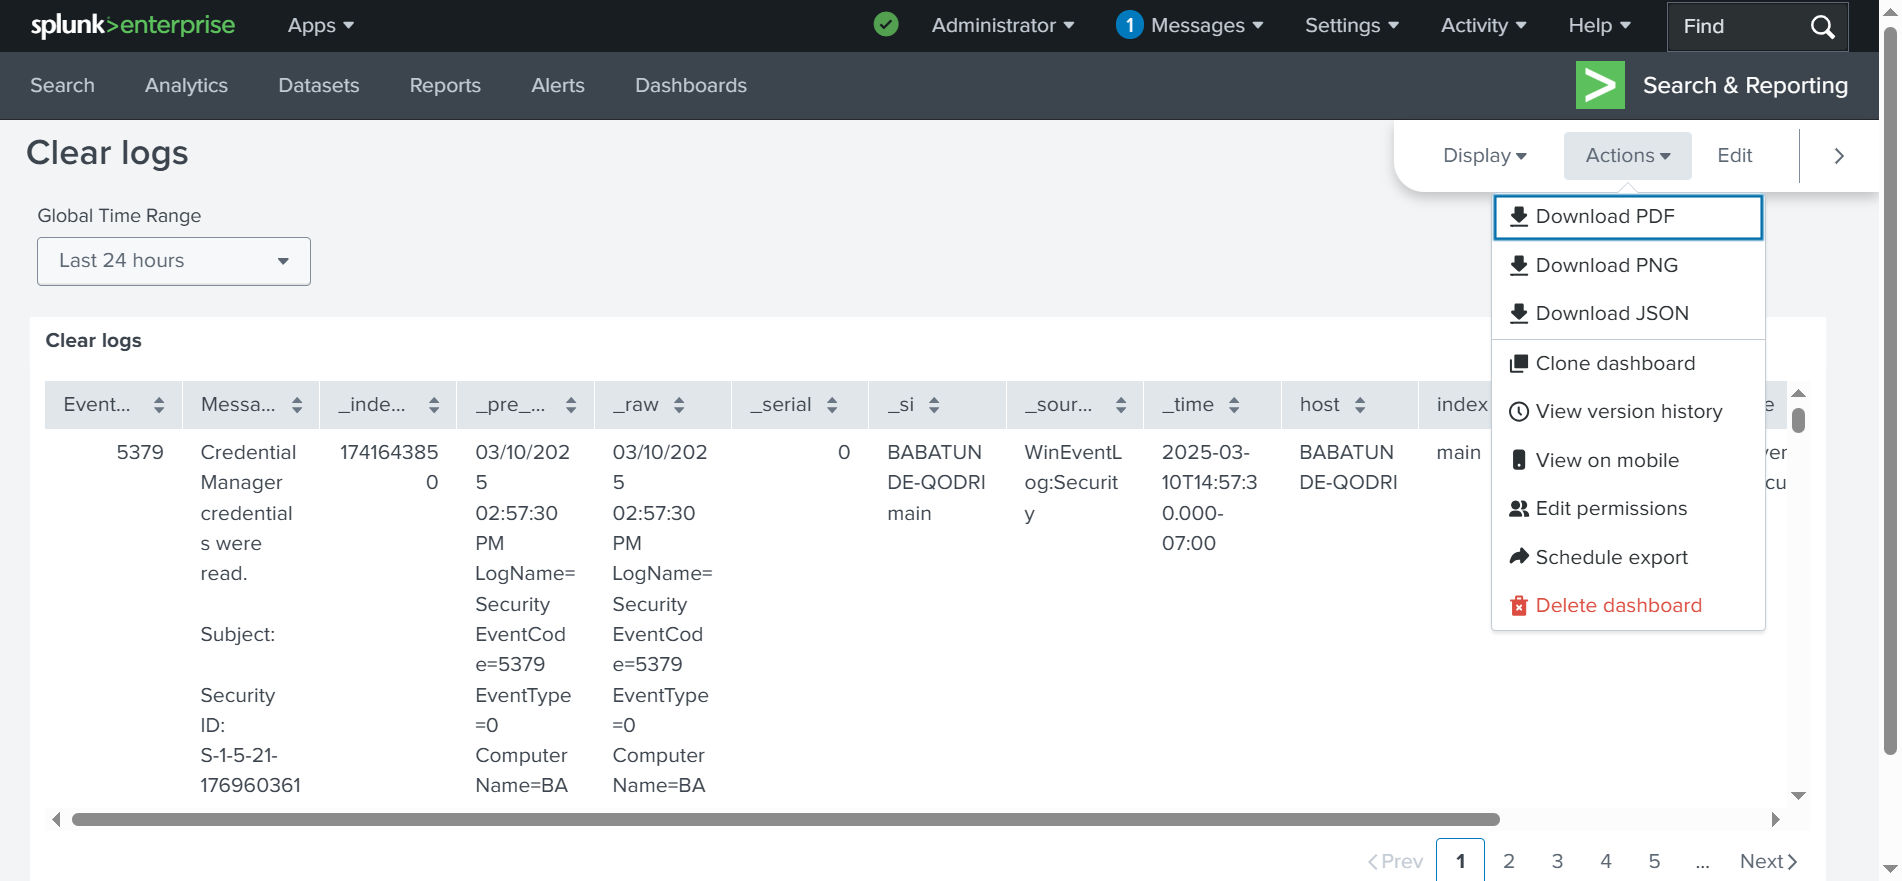
✅ This will be available under the Search & Reporting application. Having a dashboard like this is extremely useful, especially for monitoring specific data that you frequently review or need to access quickly.
Read Also: TOP 5 GRC TOOLS IN 2025
Additionally, when working with executive-level management, a well-structured dashboard can be highly beneficial. It allows you to present critical information in a clear, easy-to-read format without overwhelming them with unnecessary details.
For example, if I click Data Inputs, as shown in the screenshot below…*screenshot below around the settings, just so we can get on a different screen. 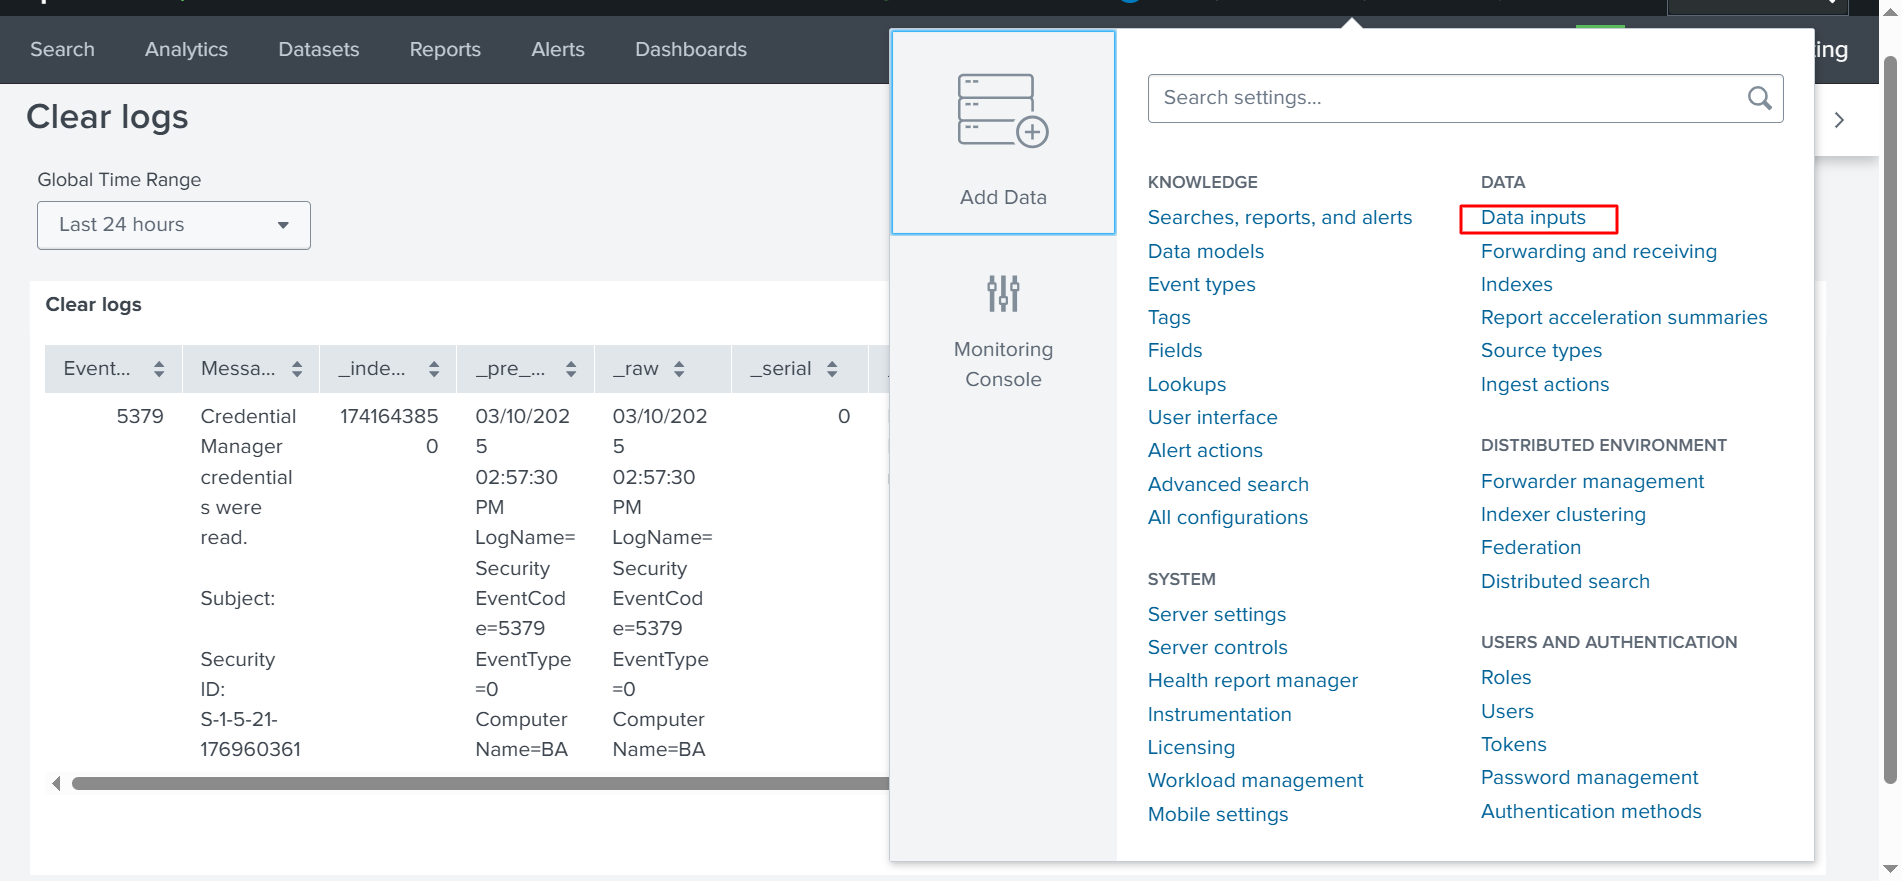
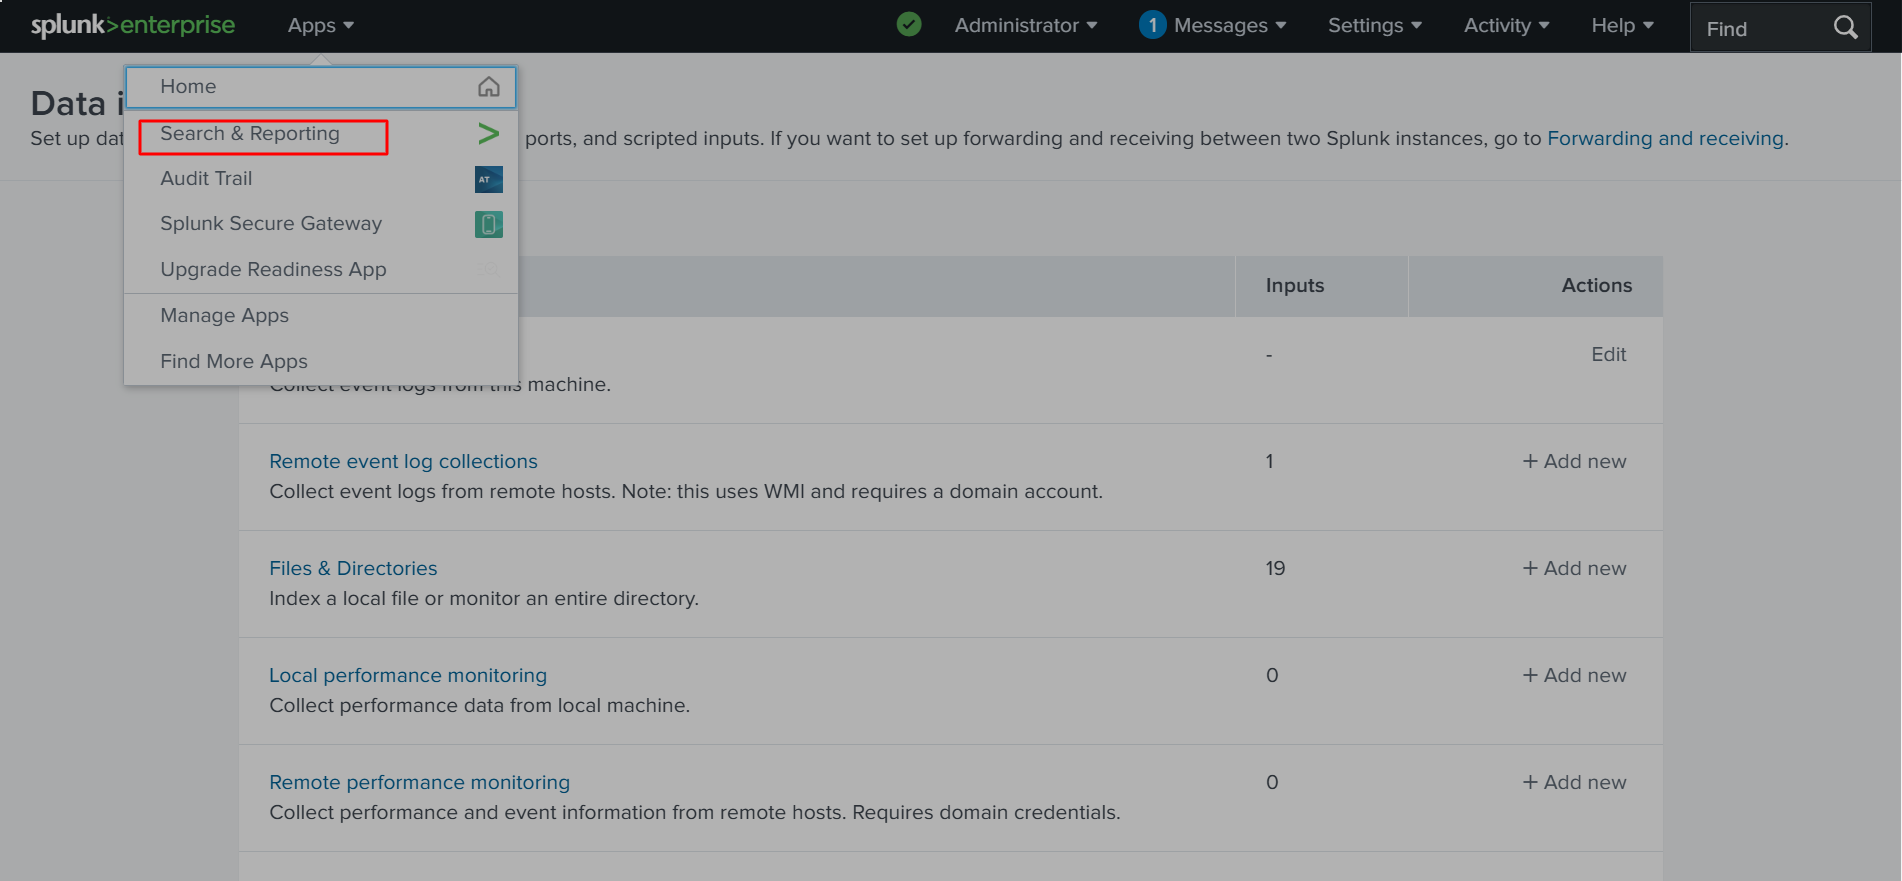
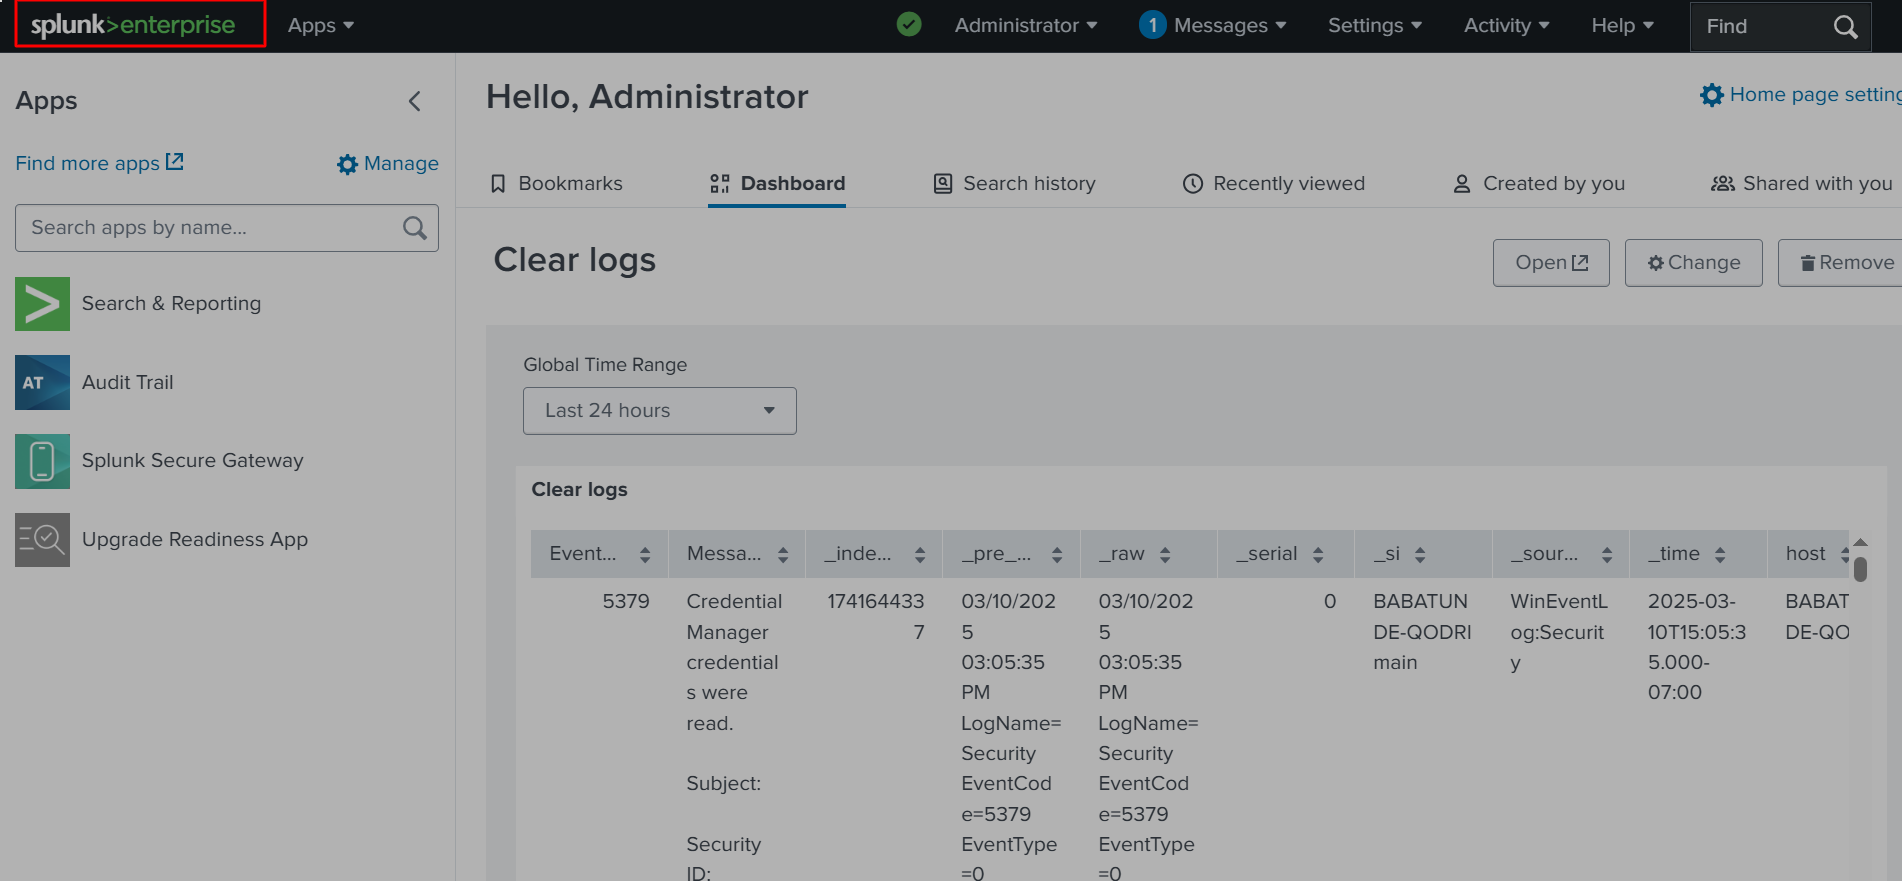
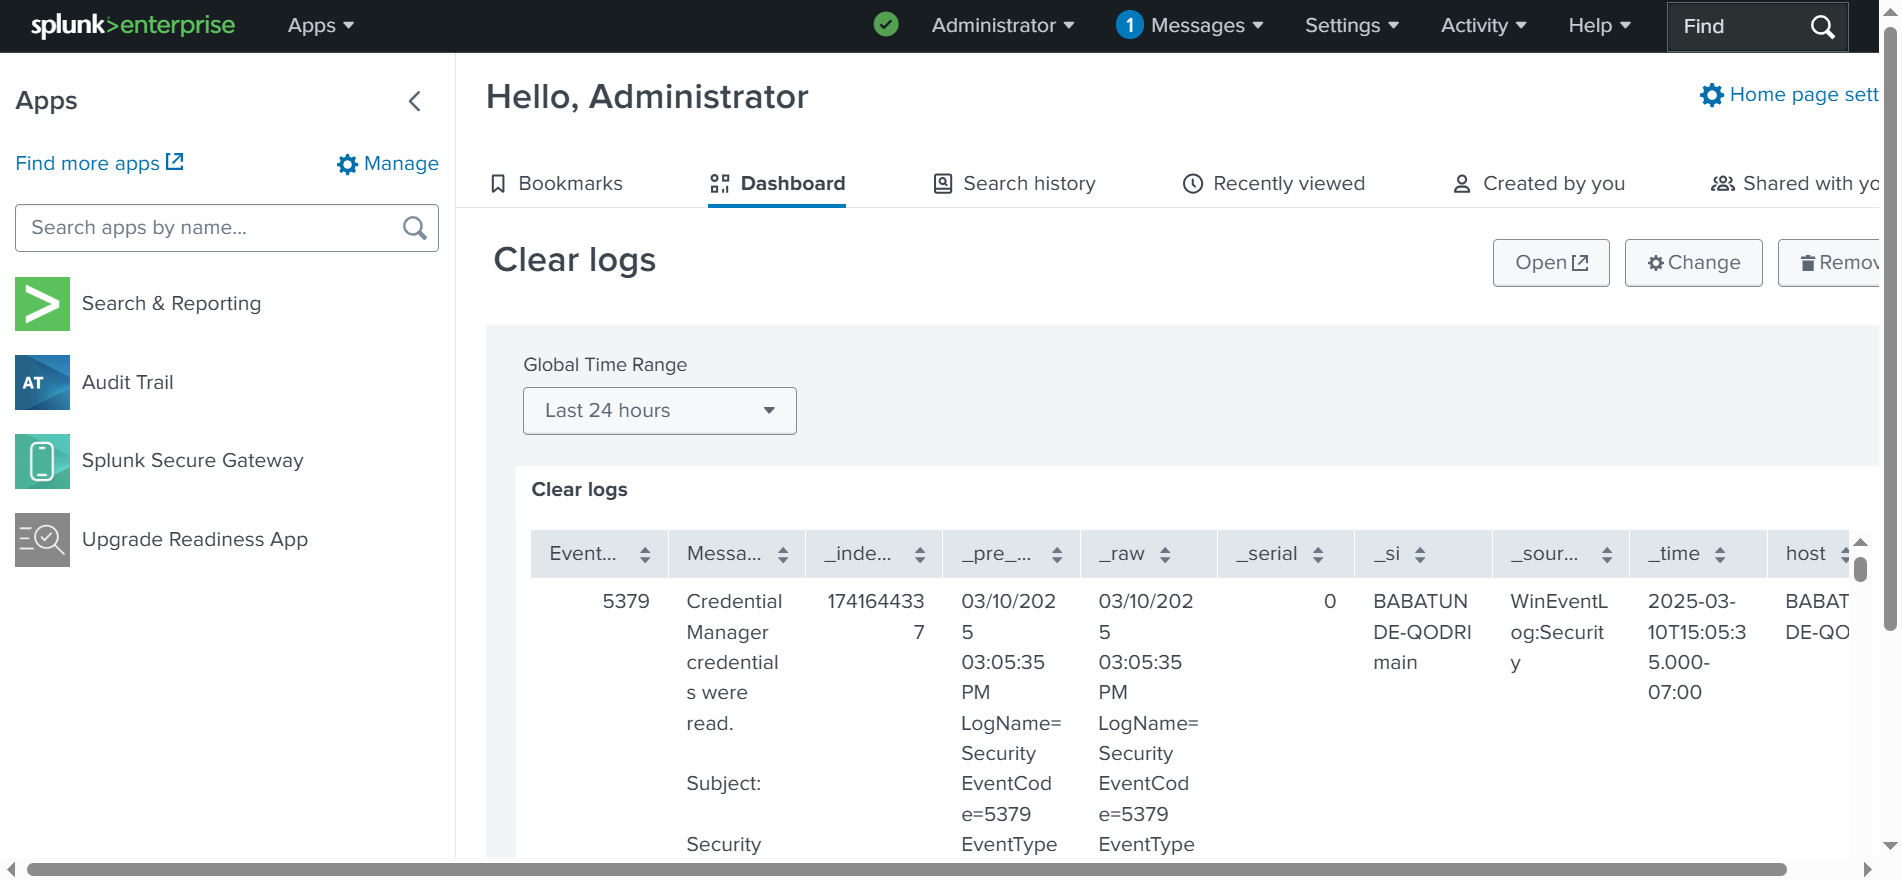
✅ Let’s go back to Apps > Search & Reporting, as shown below. 
✅ After that, we will click Splunk Enterprise to return to the homepage, where “Clear Logs” will be displayed, as shown below. You can customize the dashboard however you want, adding different tables and visualizations. This is just an example of how dashboards can be used to quickly and easily display important information.

✅ Finally, one useful website for displaying information is Ultimate IT Security, as it provides a comprehensive list of Windows event IDs. For example, event ID 1102 indicates that the audit log was cleared, which is exactly what we were analyzing. If we click on this event, we can see detailed information, as shown below.
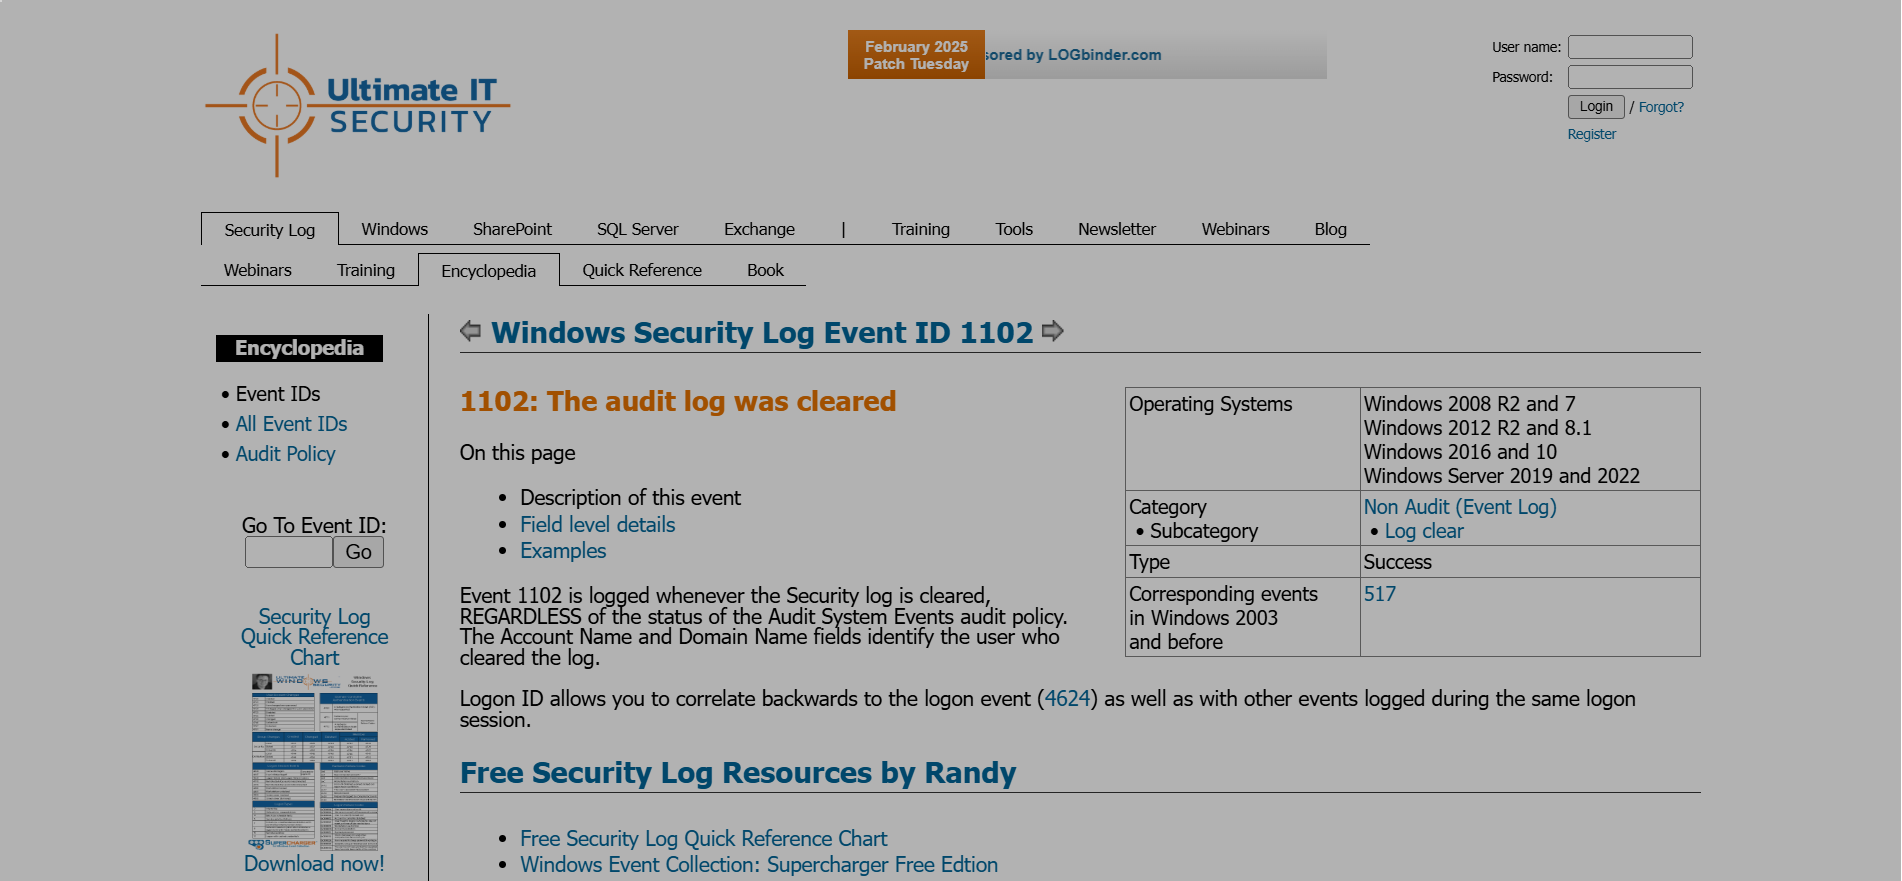
✅ If you’re unsure about a specific event ID or need detailed information, this is a great resource to use.
You 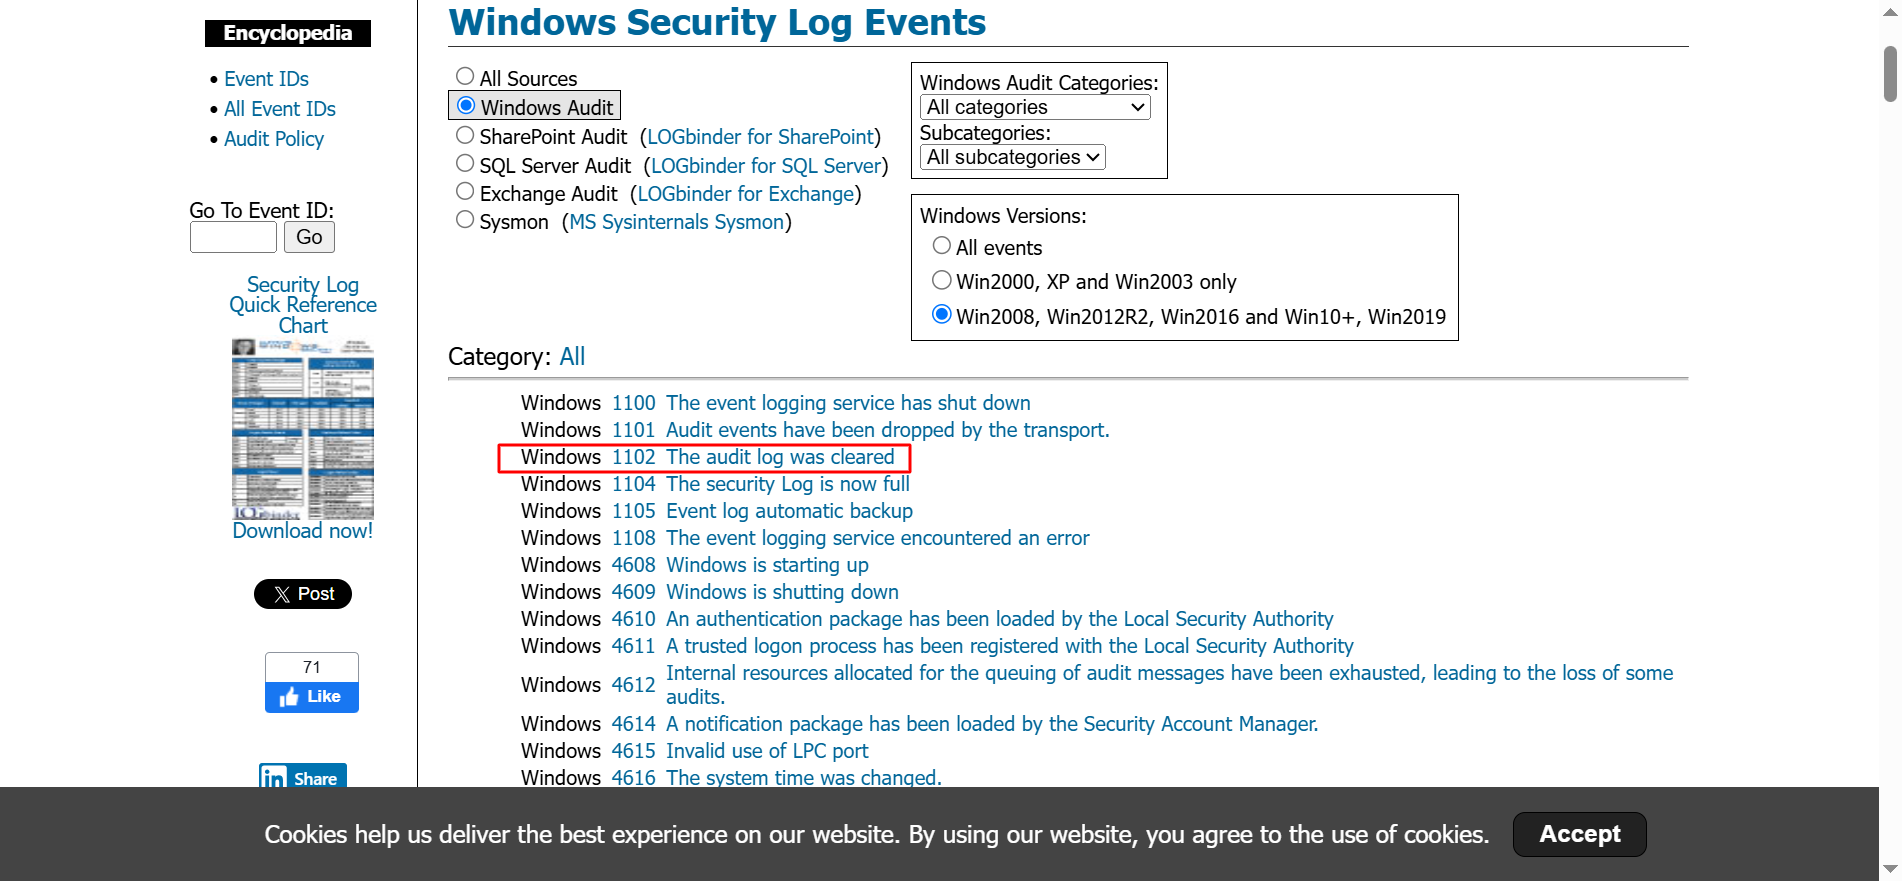
✅ These are the key events or logs that we might want to monitor in Splunk.
To see how this works in real-time, I created a video and uploaded it to my LinkedIn. You can access it via the link below.
- https://www.linkedin.com/posts/babatunde-qodri-27716b1a5_i-just-ran-a-splunk-search-and-ingested-log-activity-7308046541548625921-Ze6R?utm_source=share&utm_medium=member_desktop&rcm=ACoAAC_mTbsBeBOdvTxEzGqv_gXoZXZDqJtXXAE
- https://www.linkedin.com/posts/babatunde-qodri-27716b1a5_splunk-cybersecurity-socanalyst-activity-7308771990239109120-XMYv?utm_source=share&utm_medium=member_desktop&rcm=ACoAAC_mTbsBeBOdvTxEzGqv_gXoZXZDqJtXXAE
Source: https://www.youtube.com/watch?v=3CiRs6WaWaU&t=183s